Figures & data
Table 1. Percentage of labeled etoposide microparticles by ascending chromatograms of 99mTc compared with free pertechnetate (Na99mTcO4−) in 2 h.
Table 2. Percentage of labeled etoposide microparticles by ascending chromatograms of 99mTc compared with free pertechnetate (Na99mTcO4−) in 8 h.
Figure 1. Etoposide microparticle mean size and size distribution.
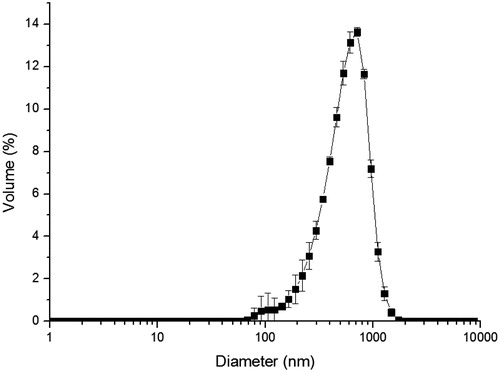
Figure 2. SEM image. The figure “A” is an immediate image, the “B” is after labeling with 99mTc and “C” is 1 month after labeling with 99mTc.
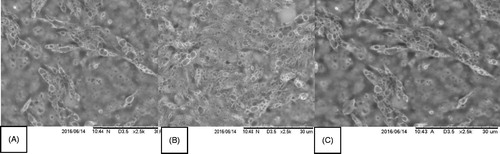
Figure 3. Biodistribution of labeled etoposide microparticles in inducted mice with lung cancer (xenograph model). The y-axis is the dose in μCi and the x-axis is the organ. Is important to observe that lesion means xenograph lung tumor.
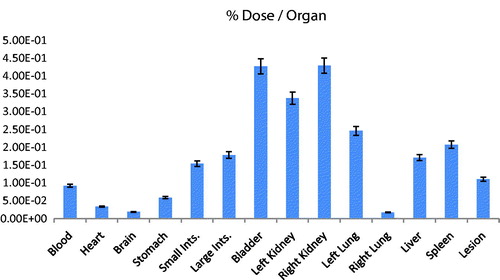
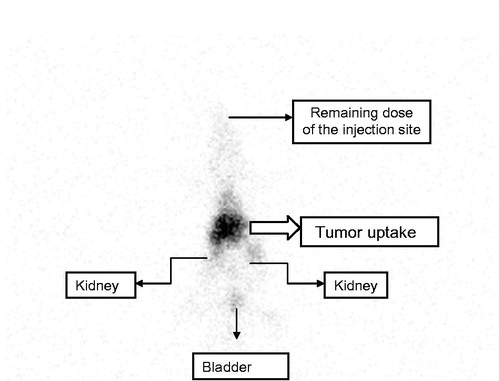
Figure 4. SPECT imaging of Balb/c nude mouse inducted with xenograft cancer model in the back.