Figures & data
Table 1. Composition of various microemulsion formulations.
Table 2. The mean scores recorded (ranging from 0 to 4) depending on the degree of infection.
Figure 1. Pseudoternary phase diagram of the system containing IPM, water: DMSO (3:1) and 3:1 weight ratio of Tween 20: Span 20.
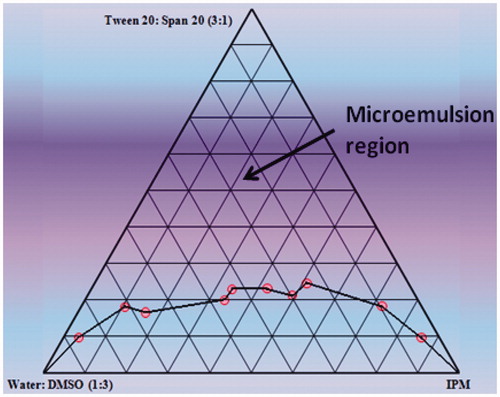
Figure 2. (A) Transmission electron micrograph depicting spherical globules (Magnification, 12,000x) (B) Particle size distribution of Formulation VI.
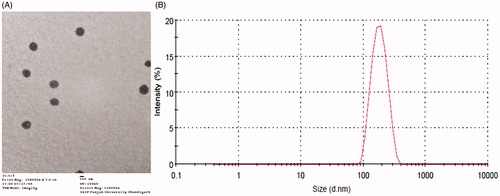
Figure 3. Comparison of cumulative amount permeated per unit area of acyclovir from various formulations in 24 h (The readers are referred to the web version of the article).
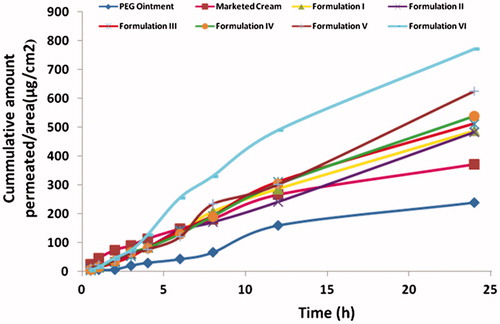
Figure 4. Comparison of flux, skin retention and permeability coefficient of various formulations through mice. (The readers are referred to the web version of the article).
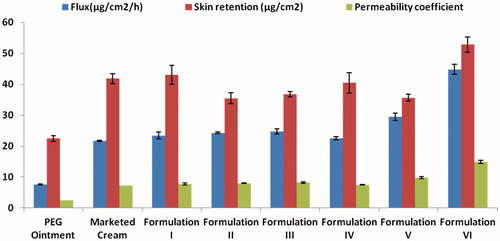
Figure 5. Histopathological photographs showing absence of any histological and pathological changes (a) Control untreated skin (b) skin treated with Formulation VI (magnification, ×100). (The readers are referred to the web version of the article).
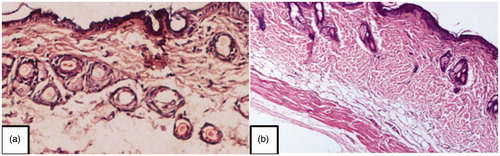
Figure 6. Visual evaluation of eradication of infection (a) Mice showing ulcerative lesions due to HSV infection (b) mice treated with once daily application of Formulation VI (c) mice treated with five times application of marketed cream. (The readers are referred to the web version of the article).
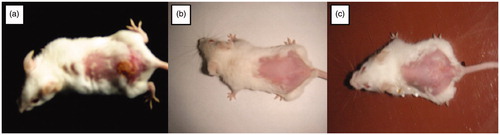
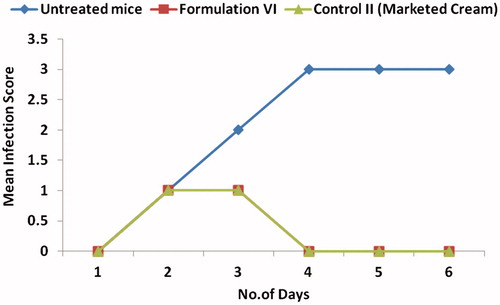
Figure 7. Reduction in mean infection score after treatment with Formulation VI. (The readers are referred to the web version of the article).