Figures & data
Figure 1. The egg extract of apple snail (a) visualized on a 4–15% gradient SDS-PAGE gel and (b) its reducing activity at various concentrations.
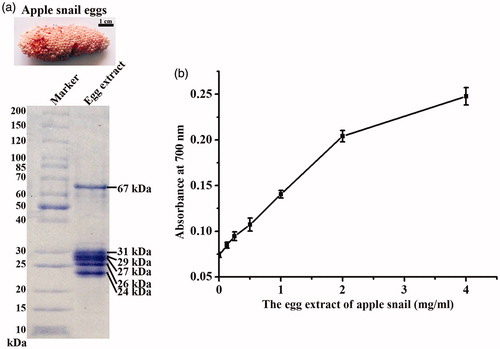
Figure 2. UV–Vis spectra of the synthesized AgNPs using different concentrations of the egg extract (2, 4, and 8 mg/ml) in the reactions (a) with glucose and (b) without glucose.
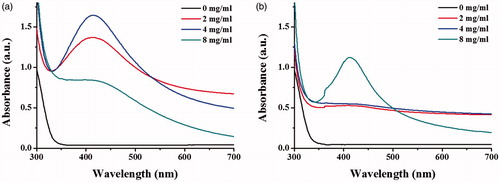
Figure 3. UV–Vis spectra of the synthesized AgNPs monitored in a time course of 48 h in the reactions (a) with glucose and (b) without glucose.
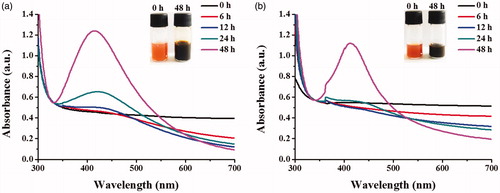
Figure 4. The images of (a) TEM and (b) XRD pattern of the synthesized AgNPs.
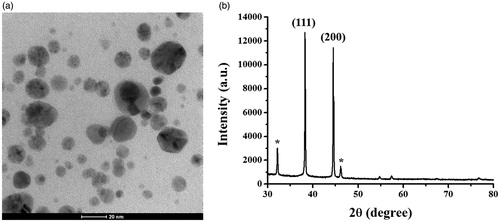
Figure 5. The images of (a) SAED-TEM and (b) EDX analyses of the synthesized AgNPs.
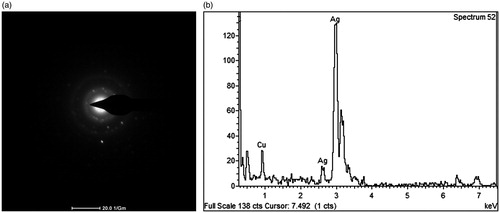
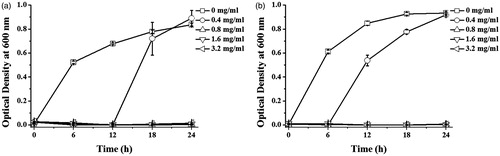
Figure 6. Growth curves of (a) E. coli and (b) S. aureus in response to the synthesized AgNPs at various concentrations.