Figures & data
Table 1. Independent and dependent variables applied in experimental design.
Figure 1. Response surface plots showing the effects of lipid, surfactant and co-surfactant on particle size (a) and entrapment efficiency (b). Perturbation plot showing the effect of lipid, surfactant and co-surfactant on particle size (c) and entrapment efficiency (d).
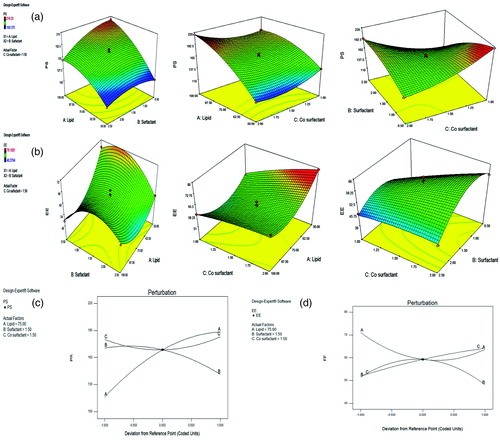
Table 2. Experimental batches and responses obtained for desired parameters.
Table 3. Analysis of variance (ANOVA) for response surface quadratic model (for PS).
Table 4. Analysis of variance (ANOVA) for response surface quadratic model (for EE).
Figure 2. Conjugation reaction between –COOH group of palmitic acid and –NH2 group of RAGE antibody.
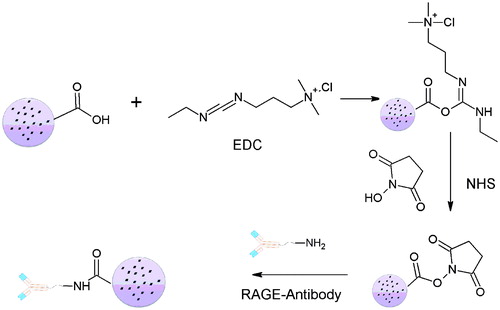
Figure 3. FT-IR Spectra of Palmitic acid (a); RAGE antibody (b); and DADS-RAGE-SLN (c).
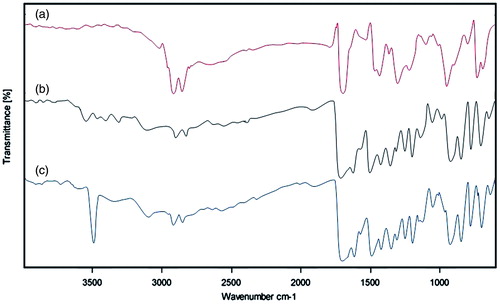
Figure 4. Particle size distribution of DADS-SLN (a) and DADS-RAGE-SLN (b); SEM (c) and TEM (d) of DADS-RAGE-SLNs.
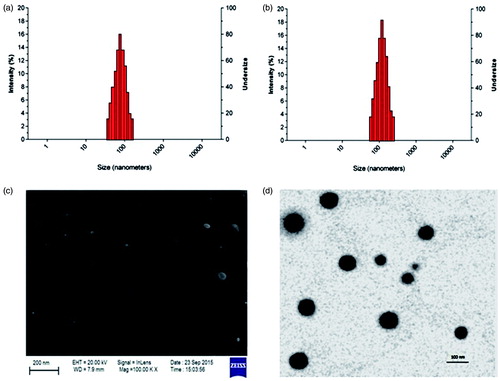
Figure 5. In vitro release of DADS from DADS-SLN and DADS-RAGE-SLN.
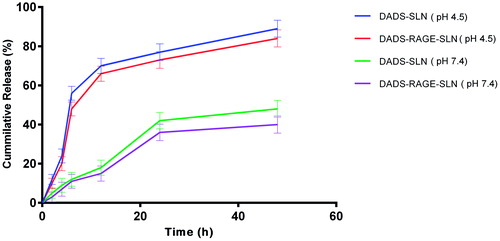
Figure 6. Qualitative (a) and quantitative (b) cell uptake of DADS-SLN and DADS-RAGE-SLN. The values are expressed as mean ± SD.*p < .05 vs DADS-SLN (n = 3).
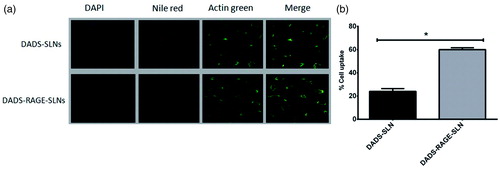
Figure 7. % cell viability after treatment with DADS, RAGE antibody, DADS-SLN, DADS-RAGE-SLN and Blank-SLN. The values are expressed as mean ± SD.*p < .05 vs DADS-SLN (n = 3).
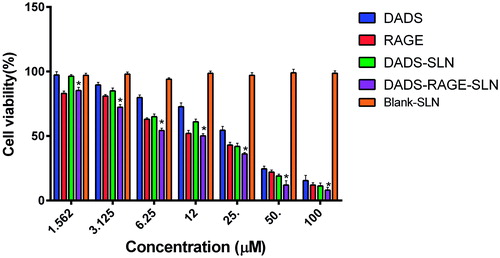
Figure 8. Apoptosis measurement using Annexin-V/PI assay in control (a); DADS-treated cells (b); DADS-SLN-treated cells (c) and DADS-RAGE-SLN-treated cells (d).
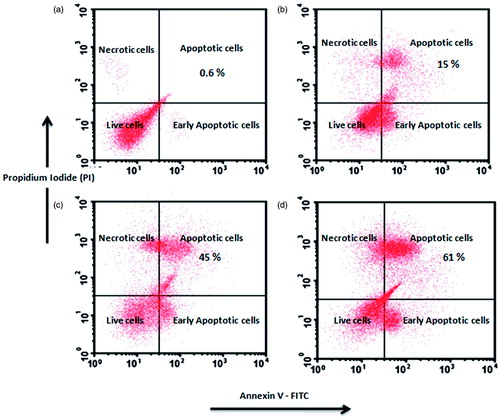
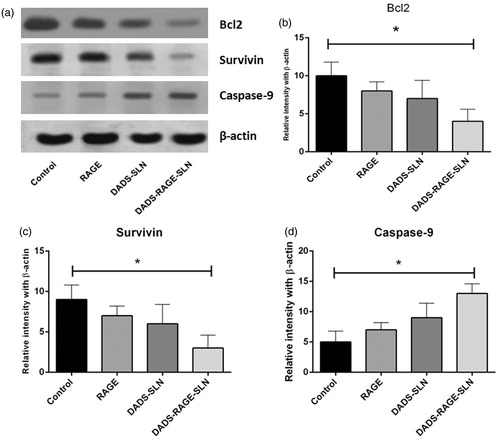
Figure 9. Expression pattern of Bcl2, survivin and caspase-9 in MDA-MB231 cells (a); Quantitative analysis of Bcl2 (b), survivin (c) and caspase-9 (d) by observing relative intensity with β-actin. The values are expressed as mean ± SD. *p < .05 vs control (n = 3).