2,511
Views
73
CrossRef citations to date
0
Altmetric
Articles

Hepatoprotective and free radical scavenging actions of quercetin nanoparticles on aflatoxin B1-induced liver damage: in vitro/in vivo studies

, , , , &
Pages 411-420 | Received 07 Mar 2017, Accepted 31 Mar 2017, Published online: 20 Apr 2017

Figures & data

Figure 1. (A) TEM image of quercetin nanocrystals. The size of quercetin nanocrystals was in the range of 30–60 nm with the average size 50 nm. (B) Dynamic light scattering (DLS) of the quercetin nanocrystals. (C) Zeta potential of nanoparticles with the average amount of −24 mV.
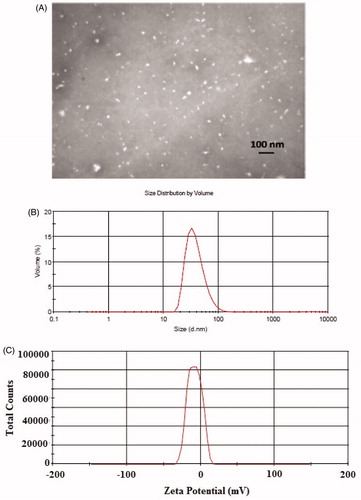
Figure 1. (A) TEM image of quercetin nanocrystals. The size of quercetin nanocrystals was in the range of 30–60 nm with the average size 50 nm. (B) Dynamic light scattering (DLS) of the quercetin nanocrystals. (C) Zeta potential of nanoparticles with the average amount of −24 mV.

Figure 2. (A) Effect of the AFB1 on the viability of rat hepatocytes. (B) Effect of quercetin (Q) (100 μM), Q-NPs (quercetin nanoparticles) (100 μM), N-acetyl cysteine (NAC) (200 μM) on the viability of AFB1-treated hepatocytes. Isolated rat hepatocytes were incubated for 4 h with DMEM containing different concentrations of AFB1. Antioxidants were added 1 h after AFB1 (25 μM) treatment. The viability was determined by MTT reduction assay and expressed as percentage of control. Data are expressed as mean ± SEM of three independent experiments. *Different from control group (p < .05). aQ (100 μM) and/or NAC (200 μM) significantly decreased hepatocyte membrane lysis compared to AFB1-treated hepatocytes. **Q-NPs significantly decreased hepatocyte membrane lysis compared to AFB1 and Q-treated hepatocytes.
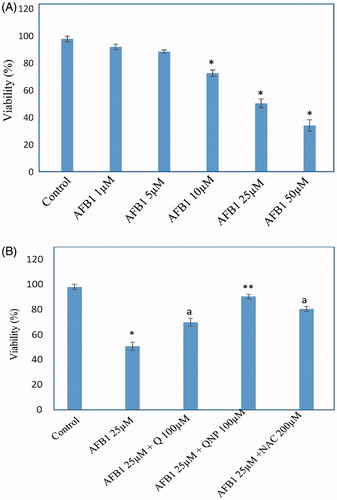
Figure 2. (A) Effect of the AFB1 on the viability of rat hepatocytes. (B) Effect of quercetin (Q) (100 μM), Q-NPs (quercetin nanoparticles) (100 μM), N-acetyl cysteine (NAC) (200 μM) on the viability of AFB1-treated hepatocytes. Isolated rat hepatocytes were incubated for 4 h with DMEM containing different concentrations of AFB1. Antioxidants were added 1 h after AFB1 (25 μM) treatment. The viability was determined by MTT reduction assay and expressed as percentage of control. Data are expressed as mean ± SEM of three independent experiments. *Different from control group (p < .05). aQ (100 μM) and/or NAC (200 μM) significantly decreased hepatocyte membrane lysis compared to AFB1-treated hepatocytes. **Q-NPs significantly decreased hepatocyte membrane lysis compared to AFB1 and Q-treated hepatocytes.
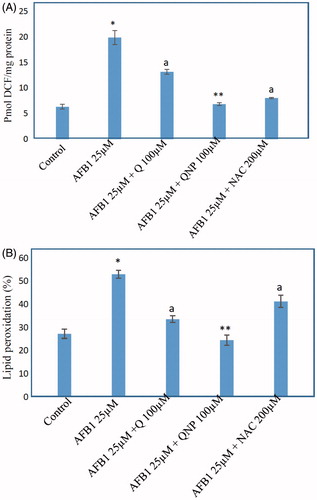
Figure 3. (A) Effect of quercetin (Q) (100 μM), Q-NPs (quercetin nanoparticles) (100 μM), N-acetyl cysteine (NAC) (200 μM) on the ROS generation of AFB1-treated hepatocytes. ROS is measured as pmole DCF formed/mg protein. (B) TBARS formation induced by AFB1 and the protective effects of 100 μM Q (quercetin), N-acetyl cysteine (NAC) (200 μM) and Q-NPs (quercetin nanoparticles). Isolated rat hepatocytes were incubated for 4 h with DMEM containing AFB1 (25 μM). Data are expressed as mean ± SEM of three independent experiments. *Different from control group (p < .05). aQ (100 μM) and/or NAC (200 μM) significantly decreased hepatocyte membrane lysis compared to AFB1-treated hepatocytes. **Q-NPs significantly decreased hepatocyte membrane lysis compared to AFB1 and Q-treated hepatocytes.
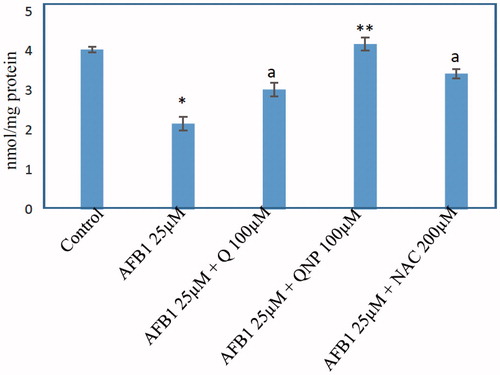
Figure 3. (A) Effect of quercetin (Q) (100 μM), Q-NPs (quercetin nanoparticles) (100 μM), N-acetyl cysteine (NAC) (200 μM) on the ROS generation of AFB1-treated hepatocytes. ROS is measured as pmole DCF formed/mg protein. (B) TBARS formation induced by AFB1 and the protective effects of 100 μM Q (quercetin), N-acetyl cysteine (NAC) (200 μM) and Q-NPs (quercetin nanoparticles). Isolated rat hepatocytes were incubated for 4 h with DMEM containing AFB1 (25 μM). Data are expressed as mean ± SEM of three independent experiments. *Different from control group (p < .05). aQ (100 μM) and/or NAC (200 μM) significantly decreased hepatocyte membrane lysis compared to AFB1-treated hepatocytes. **Q-NPs significantly decreased hepatocyte membrane lysis compared to AFB1 and Q-treated hepatocytes.
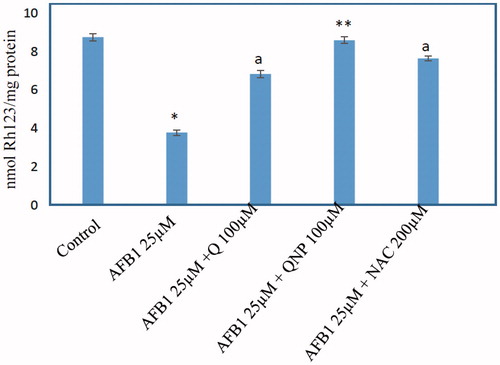
Figure 4. Effect of quercetin (Q) (100 μM), Q-NPs (quercetin nanoparticles) (100 μM), N-acetyl cysteine (NAC) (200 μM) on the glutathione depletion induced by AFB1 in primary rat hepatocytes. GSH level is measured as nmole/mg protein. Isolated rat hepatocytes were incubated for 4 h with DMEM containing different AFB1 (25 μM). Data are expressed as mean ± SEM of three independent experiments. *Different from control group (p < .05). aQ(100 μM) and/or NAC (200 μM) significantly decreased hepatocyte membrane lysis compared to AFB1-treated hepatocytes. **Q-NPs significantly decreased hepatocyte membrane lysis compared to AFB1 and Q-treated hepatocytes.

Figure 4. Effect of quercetin (Q) (100 μM), Q-NPs (quercetin nanoparticles) (100 μM), N-acetyl cysteine (NAC) (200 μM) on the glutathione depletion induced by AFB1 in primary rat hepatocytes. GSH level is measured as nmole/mg protein. Isolated rat hepatocytes were incubated for 4 h with DMEM containing different AFB1 (25 μM). Data are expressed as mean ± SEM of three independent experiments. *Different from control group (p < .05). aQ(100 μM) and/or NAC (200 μM) significantly decreased hepatocyte membrane lysis compared to AFB1-treated hepatocytes. **Q-NPs significantly decreased hepatocyte membrane lysis compared to AFB1 and Q-treated hepatocytes.

Table 1. Effect of Q and Q-NPs on liver function in AFB1-admministrated rats.

Figure 5. Effect of quercetin (Q) (100 μM), Q-NPs (quercetin nanoparticles) (100 μM), N-acetyl cysteine (NAC) (200 μM) on the mitochondrial membrane potential in AFB1-treated rat hepatocytes. MMP level is measured as nmole Rh 123/mg protein. Isolated rat hepatocytes were incubated for 4 h with DMEM containing AFB1 (25 μM). Data are expressed as mean ± SEM of three independent experiments. *Different from control group (p < .05). aQ (100 μM) and/or NAC (200) significantly decreased hepatocyte membrane lysis compared to AFB1-treated hepatocytes. **Q-NPs significantly decreased hepatocyte membrane lysis compared to AFB1 and Q-treated hepatocytes.

Figure 5. Effect of quercetin (Q) (100 μM), Q-NPs (quercetin nanoparticles) (100 μM), N-acetyl cysteine (NAC) (200 μM) on the mitochondrial membrane potential in AFB1-treated rat hepatocytes. MMP level is measured as nmole Rh 123/mg protein. Isolated rat hepatocytes were incubated for 4 h with DMEM containing AFB1 (25 μM). Data are expressed as mean ± SEM of three independent experiments. *Different from control group (p < .05). aQ (100 μM) and/or NAC (200) significantly decreased hepatocyte membrane lysis compared to AFB1-treated hepatocytes. **Q-NPs significantly decreased hepatocyte membrane lysis compared to AFB1 and Q-treated hepatocytes.

Table 2. Effect of the quercetin and its nanoparticles on liver function markers, antioxidant enzyme activities and lipid peroxidation in rats with aflatoxin B1-induced hepatotoxicity.

Reprints and Corporate Permissions

Please note: Selecting permissions does not provide access to the full text of the article, please see our help page How do I view content?

To request a reprint or corporate permissions for this article, please click on the relevant link below:

Academic Permissions

Please note: Selecting permissions does not provide access to the full text of the article, please see our help page How do I view content?

Obtain permissions instantly via Rightslink by clicking on the button below:

If you are unable to obtain permissions via Rightslink, please complete and submit this Permissions form. For more information, please visit our Permissions help page.