
Figures & data
Figure 1. Flow diagram of the current study.
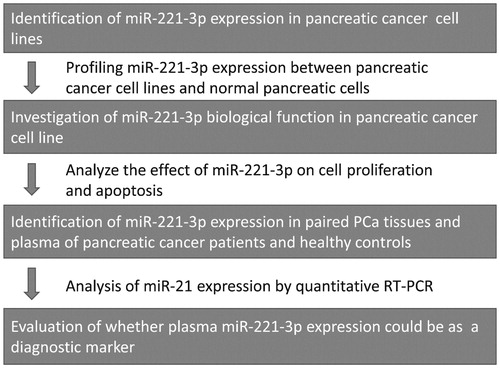
Figure 2. Expression of miR-221-3p in PCa cell lines and normal pancreases ductal epithelial cells. Compared with H6C7 and HPDE, SW1990 showed highest expression of miR-221-3p (A). PCa cell lines had higher miR-221-3p expression (B).
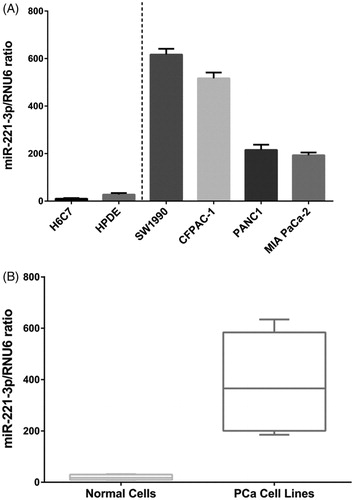
Figure 3. Compared with negative control (NC), mimics of miR-221-3p increased cell proliferation rate in SW1990 cell line, while inhibitor of miR-221-3p reduced cell proliferation (A). For cell apoptosis analysis, miR-221-3p inhibitor increased the percentage of apoptotic cells, while miR-221-3p mimics decreased the percentage of apoptotic cells (B). *p < .05, **p < .01.
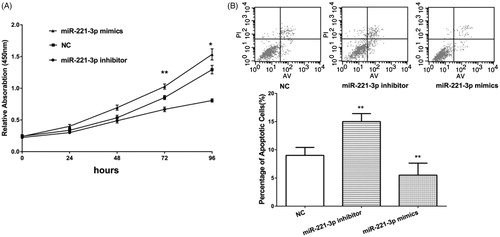
Figure 4. Expression miR-221-3p was analysed in 21 pairs of PCa tissues and adjacent non-tumour tissues (A), and miR-221-3p expression is significantly higher in PCa tissues (B). ROC curve suggested that the AUC of miR-221-3p (0.687) is larger than that of CA19-9 (0.589).
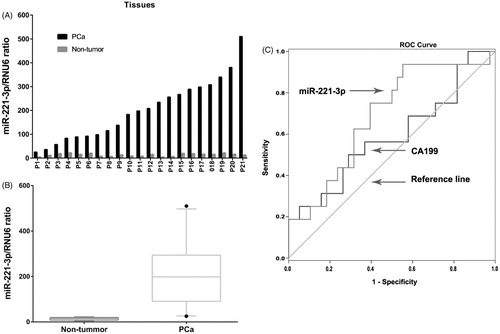
Table 1. Association between plasma miR-221-3p expression level and clinical characteristics of PCa patients.