Figures & data
Table 1. Primer sequences for PCR for each target gene.
Figure 1. Colour changes and UV?visible absorption spectrum of biologically synthesized silver nanoparticles. (A) cell-free culture filtrate of B. brevis KN8(2) without AgNO3 [yellow colour]; (B) cell-free culture filtrate of B. brevis KN8(2) with1 mM AgNO3 [dark brown colour].
![Figure 1. Colour changes and UV?visible absorption spectrum of biologically synthesized silver nanoparticles. (A) cell-free culture filtrate of B. brevis KN8(2) without AgNO3 [yellow colour]; (B) cell-free culture filtrate of B. brevis KN8(2) with1 mM AgNO3 [dark brown colour].](/cms/asset/49cbba32-9fd3-4800-a26a-4bd4c9402971/ianb_a_1324461_f0001_c.jpg)
Figure 2. FESEM image of biologically synthesized silver nanoparticles.
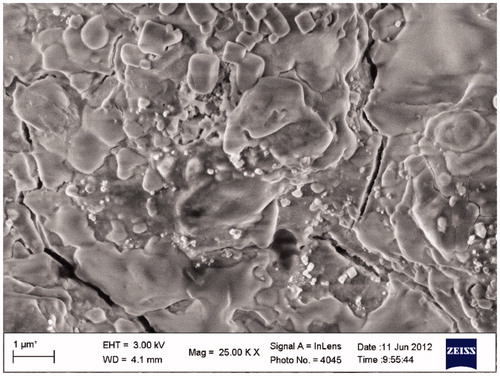
Figure 3. XRD spectrum of biologically synthesized silver nanoparticles.
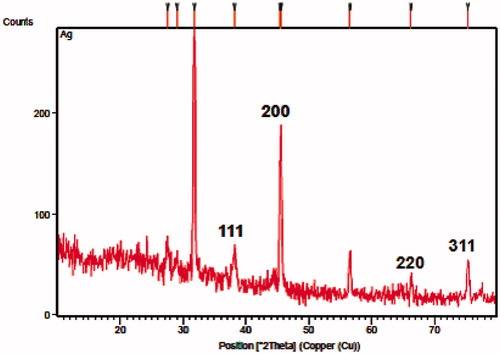
Figure 4. DLS pattern of biologically synthesized silver nanoparticles. (A) Particle size distribution; (B) zeta potential measurement.
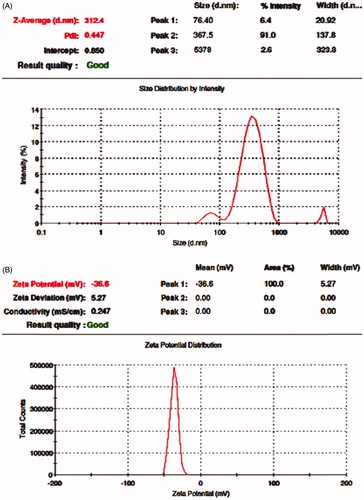
Figure 5. FT-IR spectrum: (A) extracellular extract secreted by B. brevis KN8(2); (B) biologically synthesized silver nanoparticles.
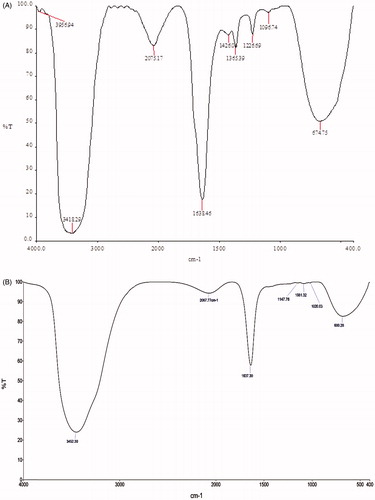
Figure 6. LC-ESI-MS/MS spectrum of extracellular extract secreted by B. brevis KN8(2).
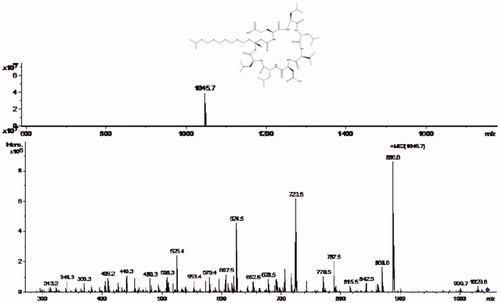
Figure 7. Surfactin-stabilized AgNPs (SSAgNPs) accelerated wound repair in P. aeruginosa infected diabetic mice: (A) representative photographs showing wound closure morphology; (B) percentage of wound area closure at day 28; (C) P. aeruginosa bacterial counts at day 28 from control, infected untreated, infected treated with gentamycin and infected treated with SSAgNPs. Values represent mean ± SD Values are statistically significant at **p < .01, ***p < .001.
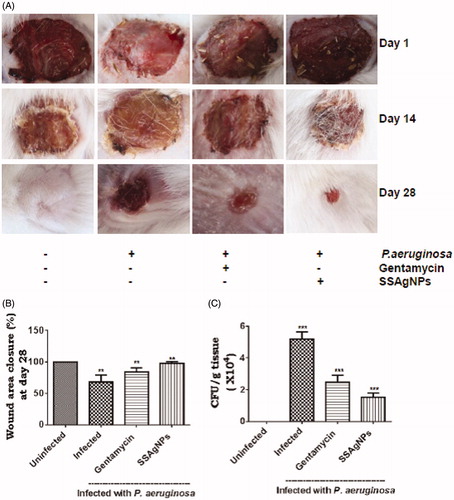
Figure 8. (A) mRNA expressions and (B) fold changes of TNF-α, IL-1β, IL-6, IL-10, TIMP-1, TIMP-2, MMP-2, MMP-9, TGF-β1, VEGF-A, and COL-1 from control, infected untreated, infected treated with gentamycin, and infected treated with SSAgNPs at day 28 were analyzed by RT-PCR. GAPDH was used as an internal control. Values represent mean ± SD. Values are statistically significant at *p < .05, **p < .01.
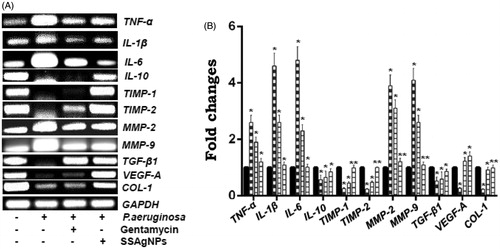
Figure 9. Histopathological analysis of granulation tissues of (A) control; (B) infected untreated; (C) infected treated with gentamycin; (D) infected treated with SSAgNPs. F: fibroblast; C: collagen; BC: blood capillary; RE: re-epithelization; IE: incomplete epithelization.
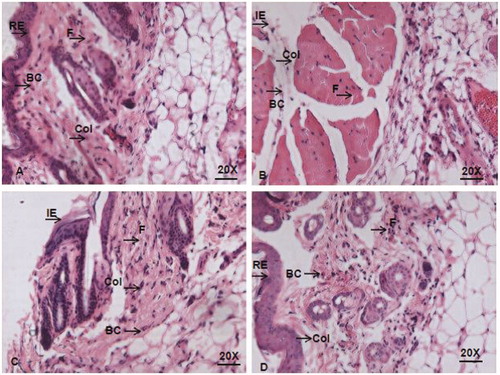
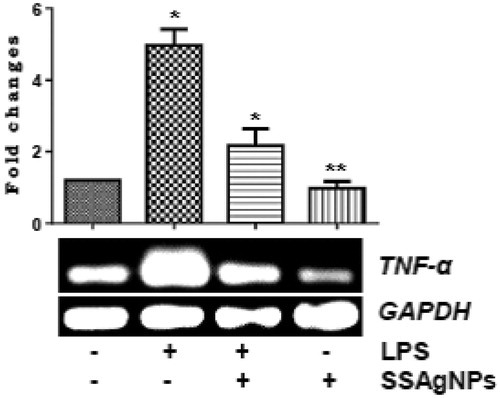
Figure 10. mRNA expressions and fold changes of LPS induced TNF-α level from skin wounds of diabetic animal treated with and without SSAgNPs was analyzed by RT-PCR. GAPDH was used as an internal control. Values represent mean ± SD. Values are statistically significant at *p < .05, **p < .01.