
Figures & data
Figure 1. FTIR spectra of (A) PEG, (B) PEG-diTS, (C) bis(EDA)-PEG, (D) MTX-bis(EDA)-PEG, and (E) MTX-EDA-PEG-EDA-HA NPs.
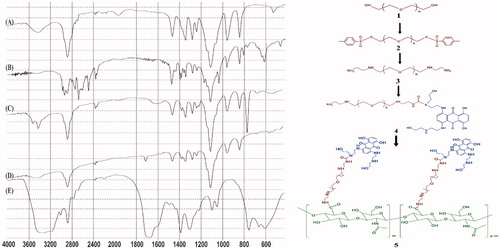
Figure 2. 1H-NMR spectra of MTX-EDA-PEG-EDA-HA NPs.
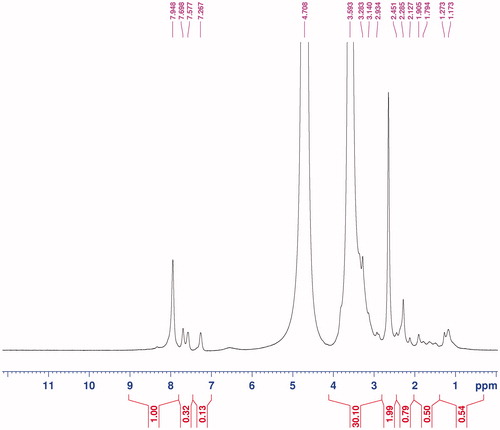
Figure 3. (A) Particle size analysis image and (B) FESEM micrograph of MTX-EDA-PEG-EDA-HA NPs.
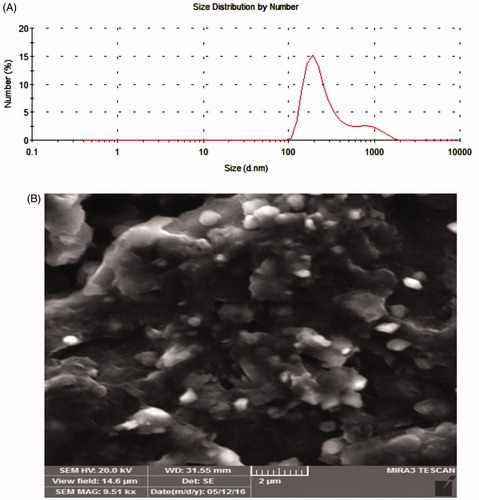
Figure 4. Release profile of mitoxantrone (MTX) from MTX-EDA-PEG-EDA-HA NPs. Nearly 87.70% of MTX has been released in 72 h under lysosome-like condition (pH 5, 37 °C and pure protease). However, 96.70% of free MTX crossed across the pores of the dialysis membrane only in 5 h.
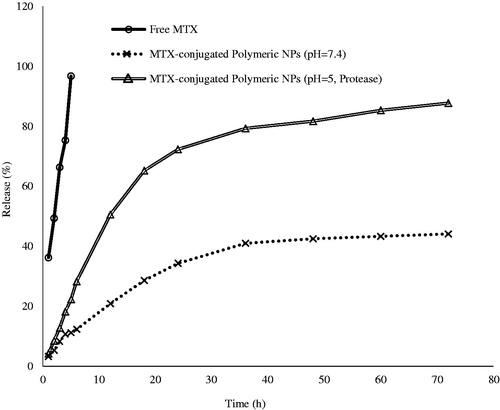
Figure 5. The cytotoxicity results of MTX-EDA-PEG-EDA-HA NPs and pure mitoxantrone in the (A) MDA-MB-231 and (B) MCF-7 cancer cell lines for 48 and 72 h. Data represents mean (n = 5) +SD.
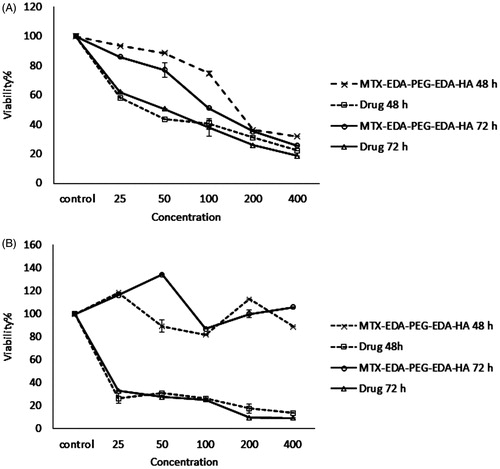
Figure 6. The docking results of HA and MTX-EDA-PEG-EDA-HA NPs with 3D structure of CD44 (A) the binding site of HA and MTX-EDA-PEG-EDA-HA NPs in CD44. (B) The conformation of HA in the binding site of CD44 and (C) the conformation of MTX-EDA-PEG-EDA-HA NPs in the binding site of CD44.
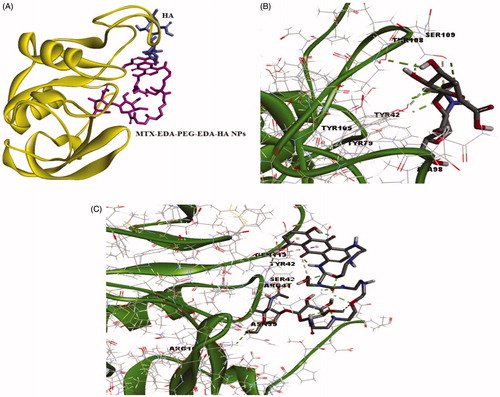
Table 1. Smina score of CD44 with different conformers of HA and MTX-EDA-PEG-EDA-HA NPs.
Figure 7. Two-dimensional scheme of interactions between the HA (A), MTX-EDA-PEG-EDA-HA NPs (B) and CD44. Only the more important residues for binding are shown.
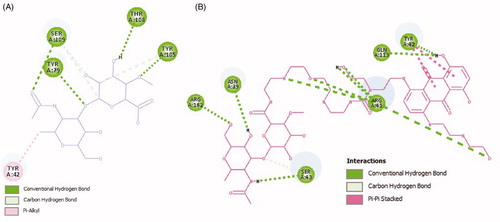
Table 2. Size information of MTX-EDA-PEG-EDA-HA NPs gained from zetasizer.