
Figures & data
Table 1. Primer sequences.
Figure 1. IC50 of paclitaxel in breast cancer cell lines at 570 nm. To achieve the IC50 of paclitaxel in included cell lines, we performed MTT assay with 0.1 ng, 1 ng, 10 ng, 100 ng, 1 μg, 10 μg and 100 μg concentrations of paclitaxel in first step. Then, we limited paclitaxel concentrations for each cell line as seen in figure.
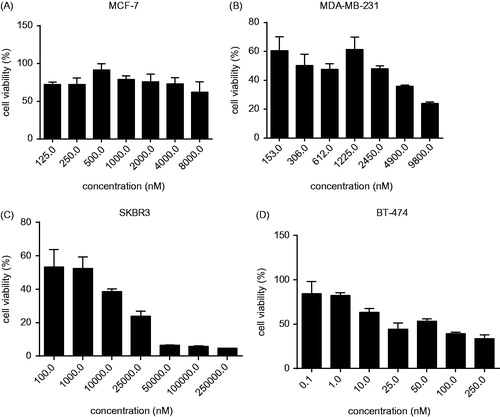
Figure 2. Expression levels of miR-21 and miR-203 before and after treatment with paclitaxel in breast cancer cell lines. Expression levels of Both miR-21 and miR-203 were increased in HER2-positive cell lines including BT-474 and SKBR3 and were decreased in HER2-negative cell lines including MCF-7 and MDA-MB-231 (**p< .005, ***p < .0005).
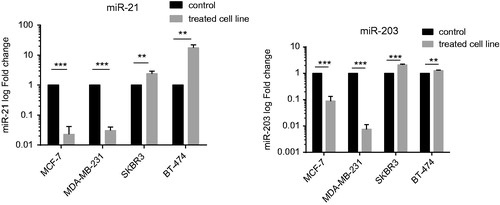
Figure 3. Expression levels of PDCD4 and TPM1 before and after treatment with paclitaxel in breast cancer cell lines. Expression level of PDCD4 and TPM1 as targets of miR-21 were increased in MDA-MB-231 and were decreased significantly in SKBR3 cells after treatment with paclitaxel. **p < .005, ***p < .0005.
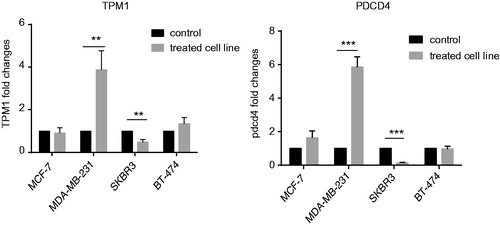
Table 2. The p values and fold changes of miR-21, miR-203, PDCD4 and TPM1.