Figures & data
Figure 1. Images of (a) the extracted sericins of S. c. ricini and B. mori visualized on a 12.5% SDS–PAGE gel and (b) their reducing activity.
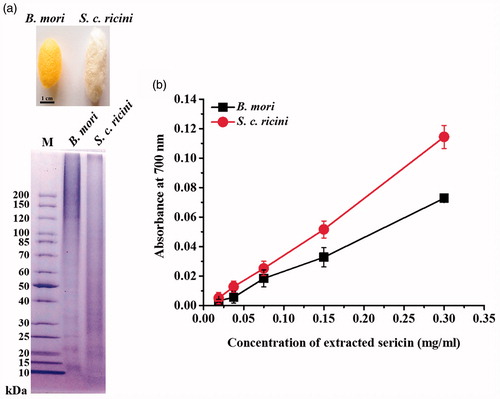
Figure 2. UV–Vis spectra of AgNPs synthesized by using (a) sericin of S. c. ricini and (b) sericin of B. mori.
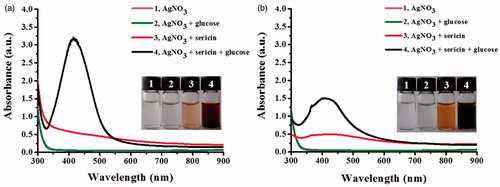
Figure 3. UV–Vis spectra of the synthesized AgNPs using different concentrations of (a) sericin of S. c. ricini and (b) sericin of B. mori.
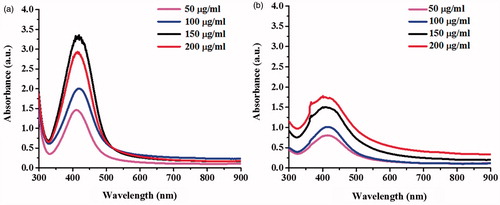
Figure 4. UV–Vis spectra of the synthesized AgNPs in a time course of 48 h using (a) sericin of S. c. ricini and (b) sericin of B. mori.
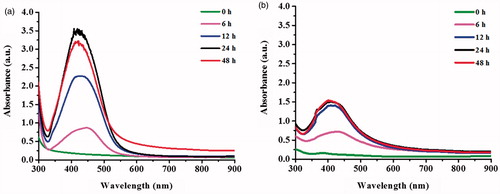
Figure 5. TEM images of AgNPs synthesized by using (a) sericin of S. c. ricini and (b) sericin of B. mori.
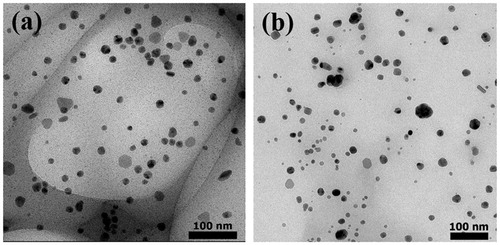
Figure 6. The representative results of TEM-SAED, TEM-EDX and XRD analyses of the synthesized AgNPs using sericin of S. c. ricini.
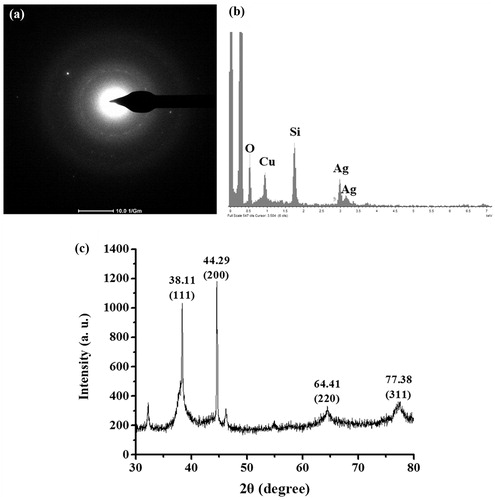
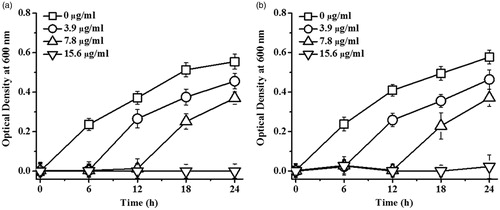
Figure 7. Growth curves of (a) E. coli and (b) S. aureus exposed to different concentrations of AgNPs synthesized by using sericin of S. c. ricini in a time course of 24 h. The data were presented as the mean ± SD of six replicate samples.