Figures & data
Figure 1. UV-Vis spectra of Cs-AuNps (a) and Cs-AgNps (b) with C. sinensis fruit extract. The upper right insets show that the resulting colloid suspensions are brown for Cs-AuNps (a) and purple for Cs-AgNps (b). FE-TEM images of Cs-AuNps (c, d) and Cs-AgNps (e, f). Elemental distribution of Cs-AuNps (g, h) and Cs-AgNps (i, j).
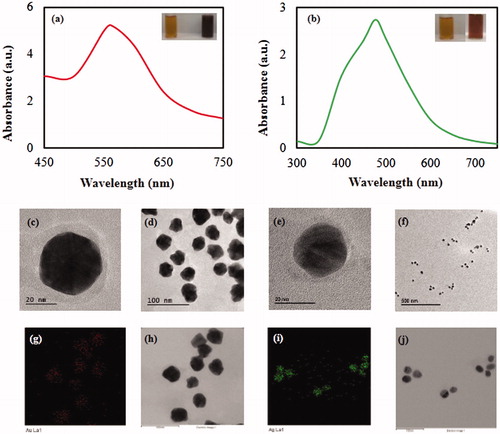
Figure 2. SAED patterns Cs-AuNps (a) and Cs-AgNps (d). XRD spectrum of Cs-AuNps (b) and Cs-AgNps (e). EDX spectrum of Cs-AuNps (c) and Cs-AgNps (f).
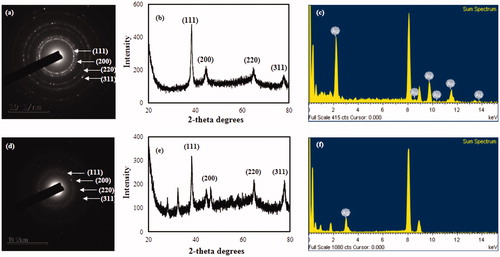
Figure 3. Particle size distributions of Cs-AuNps (a, b, c) and Cs-AgNps (d, e, f) with respect to intensity, volume, and number.
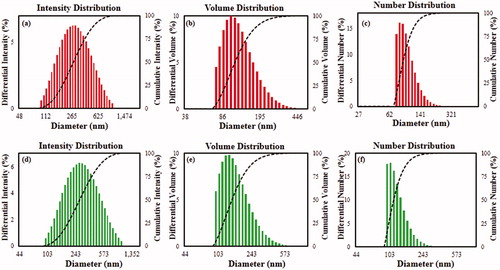
Figure 4. FTIR spectra of biosynthesized nanoparticles and plant extract.
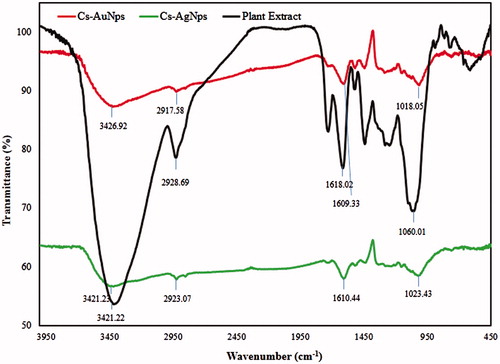
Figure 5. Dose-dependent in vitro DPPH radical-scavenging activity of biosynthesized nanoparticles.
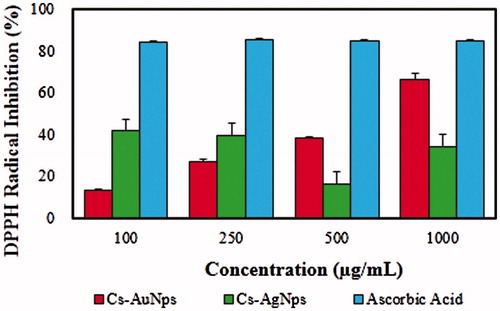
Figure 6. Zones of inhibition of purified Cs-AgNps suspensions (15, 30 45 μL) and Neomycin (NEO30) as standard antibiotics as control against S. aureus (a) and E. coli (b).
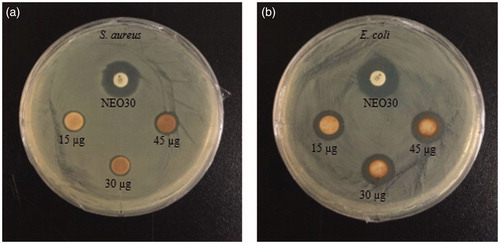
Table 1. Diameter of zone of inhibition (mm) of samples (30μL) containing purified Cs-AgNps.
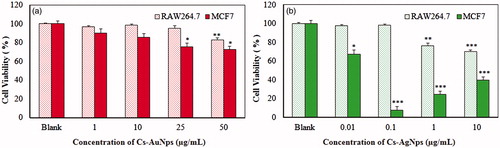
Figure 7. Dose-dependent cytotoxicity of Cs-AuNps (a) and Cs-AgNps (b) after 48 h of treatment in murine macrophage (RAW264.7).
*p < .1, **p < .001 and ***p < .001 versus blank (untreated group). The statistical significance of differences between values was evaluated by Student’s t-test.