Figures & data
Figure 1. Isolation of porcine tooth germ stem cells. (a) mandibular third molars that tooth germs (b) are isolated from. (c) minced tooth germ tissue on TCP.
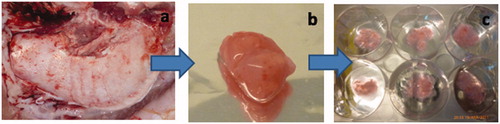
Table 1. Sequence, product size and annealing temperature (Tm) of primers specific to osteogenic mRNAs.
Figure 2. Flow cytometry histogram of (a) CD105, (b) CD90, (c) CD44, (d) CD45 and (e) CD34-labeled P1 pTGSCs (obtained by FACSCalibur).
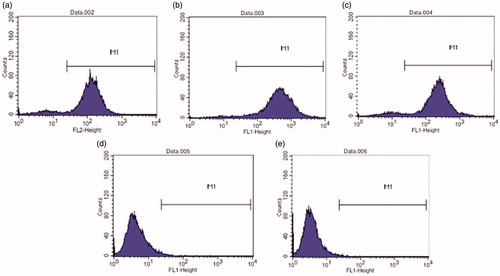
Table 2. Percent positiveness of surface antigens after 1 and 5 passages of pTGSCs.
Figure 3. (a) Histogram of PE-STRO-1 antibody labeled cells obtained by FACS Aria: Dots in Q4 region represents STRO-1(+) cells, dots in Q3 region represents STRO-1(−) cells. Cells in P2 region were sorted as STRO-1(+) and cells in P3 region were sorted as STRO-1(−). Verification of STRO-1 phenotype of cells before seeding: b) STRO-1(+) cells, (c) STRO-1(−) cells.
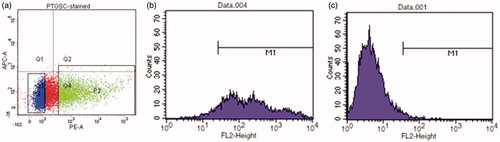
Figure 4. Osteogenic, adipogenic and chondrogenic differentiation of pTGSCs; (a) Microscopic observation of Alizarin Red (Scale bars show 100 μm), Oil Red O (Scale bars show 20 μm) and Alcian Blue (Scale bars show 50 μm) stained pTGSCs under BF) microscope after 21 days in differentiation medium, (b) Quantification of alizarin red staining, (c) Quantification of oil red O staining.
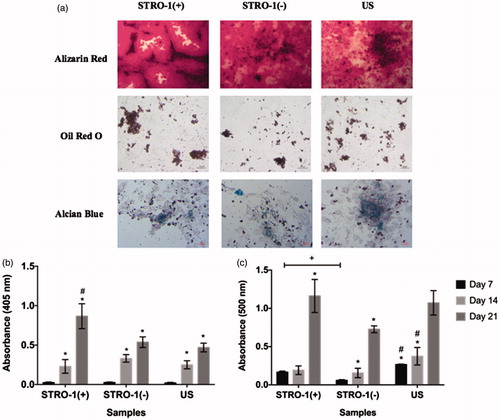
Figure 5. Cell proliferation of GM or OM added STRO-1(+), STRO-1(−) and US pTGSCs throughout 21 days of incubation. * shows the significant difference among days of the same group, # shows the significant difference among the same days of all cell types’ GM or OM groups, + shows the significance among the indicated samples (p < .05).
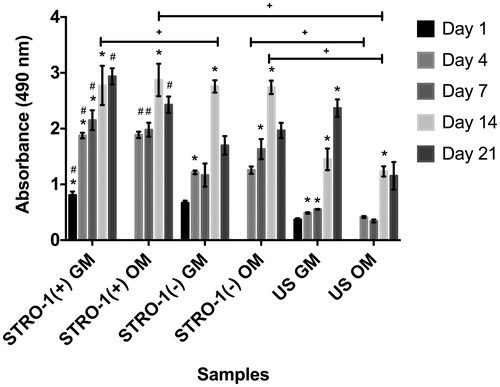
Figure 6. ALP activity of GM or OM added STRO-1(+), STRO-1(−) and US pTGSCs throughout 21 days of incubation. ALP activity was measured by OD measurements of p-nitrophenol at 405 nm and using a calibration curve of known p-nitrophenol concentrations. Values were then normalized by total protein concentrations. * shows the significant difference among days of the same group, # shows the significant difference among the same days of all cell types’ GM or OM groups, + shows the significance among the indicated samples (p < .05).
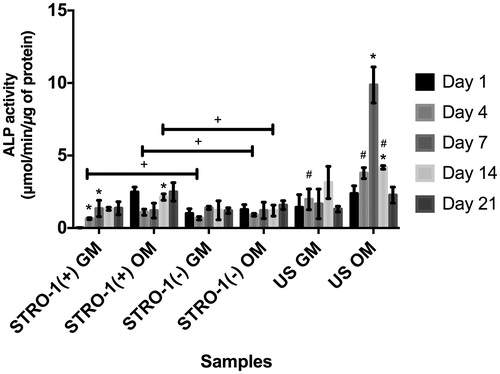
Figure 7. Mineralization of osteogenically induced GM or OM added STRO-1(+), STRO-1(−) and US pTGSCs throughout 21 days of incubation. (a) Macroscopic observation of von Kossa-stained wells, (b) Quantification of Ca deposited by cells. Ca concentration was measured by OD measurements at 612 nm and using a calibration curve of known Ca concentrations. Values were then normalized by total protein concentrations. * shows the significant difference among days of the same group, # shows the significant difference among the same days of all cell types’ GM or OM groups, + shows the significance among the indicated samples (p < .05).
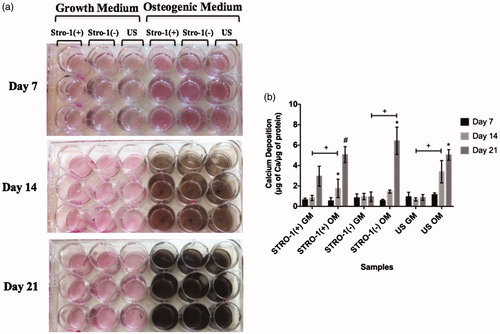
Figure 8. Microscopic observation of mineralized nodules in osteogenically induced GM or OM added STRO-1(+), STRO-1(−) and US pTGSCs cultures throughout 21 days of incubation under BF microscope. Scale bars show 100 μm.
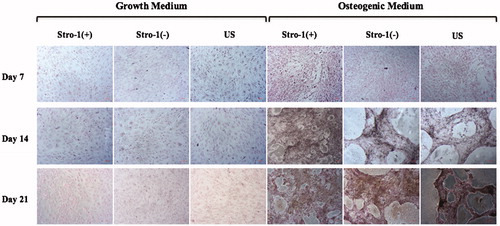
Figure 9. Confocal microscopy images of STRO-1(+), STRO-1(−) and US pTGSCs after 7, 14 and 21 days of incubation in GM or OM (20X objective). Scale bars show 20 μm. Osteocalcin (red), collagen type I (green).
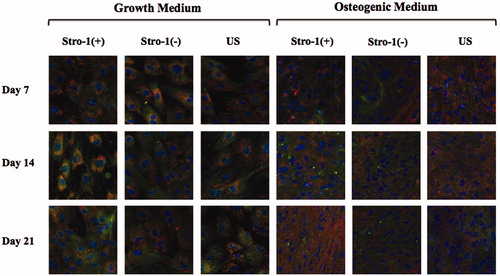
Figure 10. Analysis of osteogenic gene expression of STRO-1(+), STRO-1(−) and US pTGSCs by qPCR after 7, 14 and 21 days of incubation in GM or OM: (a) Collagen Type I (b) ON, (c) Runx2, (d) OC, (e) OP. * shows the significant difference among days of the same group, # shows the significant difference among the same days of all cell types’ GM or OM groups, + shows the significance among the indicated samples (p < .05).
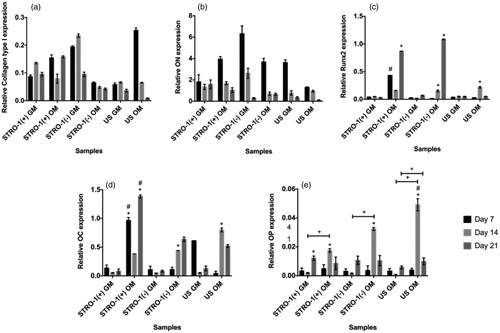
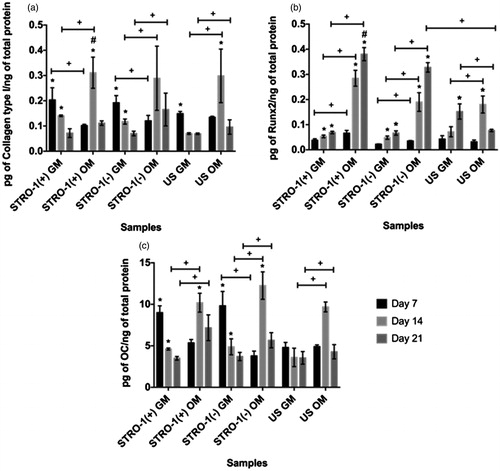
Figure 11. Analysis of osteogenic protein synthesis of STRO-1(+), STRO-1(−) and US pTGSCs by Elisa Assay after 7, 14 and 21 days of incubation in GM or OM: (a) Collagen type I, (b) Runx2, (c) OC. * shows the significant difference among days of the same group, # shows the significant difference among the same days of all cell types’ GM or OM groups, + shows the significance among the indicated samples (p < .05).