Figures & data
Figure 1. The extracted genomic DNA of E. coli on 0.8% agarose gel.
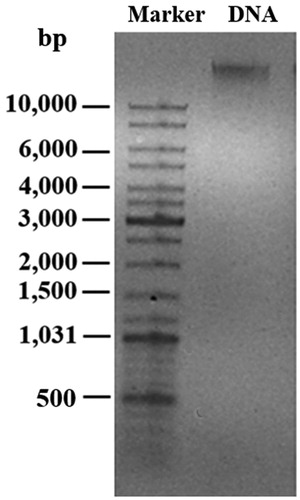
Figure 2. UV-Vis spectra of the produced AgNPs in the reactions at 25, 40, 60 and 80 °C for 24 h using (a) unheated DNA and (b) heated DNA at 100 °C for 5 min.
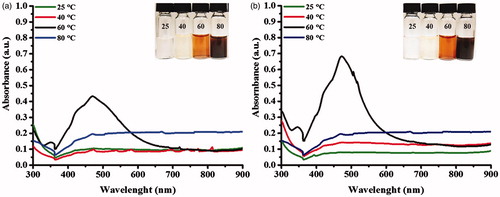
Figure 3. UV-Vis spectra of the produced AgNPs under the conditions using (a) different amounts of heated DNA and (b) different reaction times.
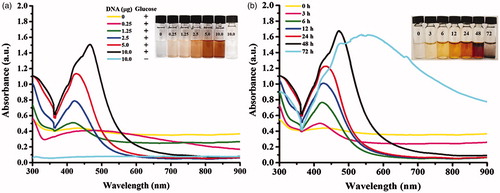
Figure 4. The representative images of (a) TEM and (b) XRD of the produced AgNPs in a reaction at 48 h.
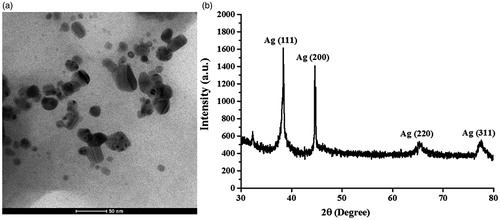
Figure 5. The identity of the produced AgNPs analyzed by (a) HR-TEM and (b) SAED-TEM.
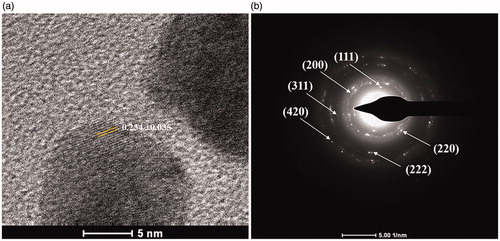
Figure 6. Growth curves of (a) E. coli and (b) S. aureus in response to AgNPs in a time course of 24 h.
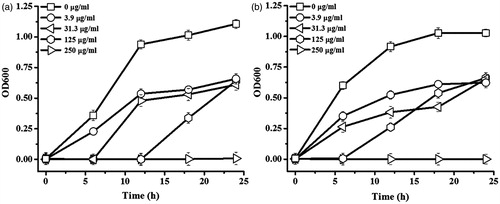
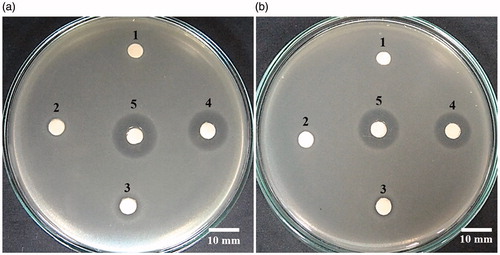
Figure 7. Growth inhibitory zones of AgNPs against (a) E. coli and (b) S. aureus. Each plate contained the filter paper discs impregnated with (1) DNA solution (negative control), (2) 1 mg AgNPs, (3) 5 mg AgNPs, (4) 10 mg AgNPs, and (5) 25 μg ampicillin (positive control).