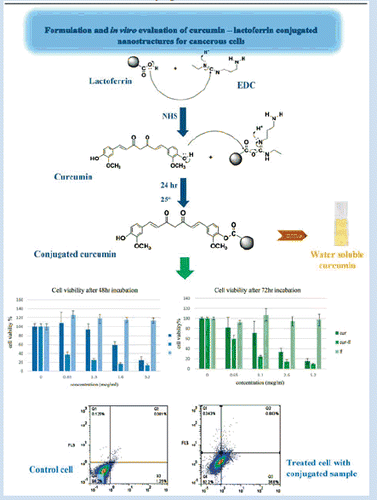
Figures & data
Scheme 1. Reaction and conditions. (a) NHS, (b) room temperature, (c) 24 h.
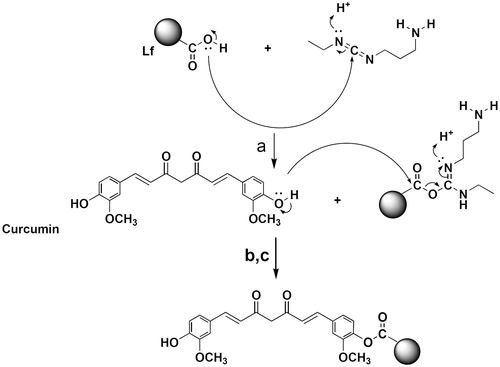
Figure 1. Calibration curve obtained from UV spectrophotometric method of curcumin assay.
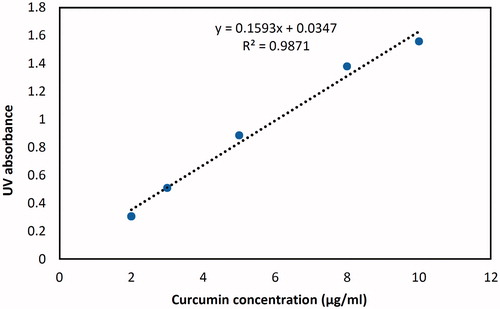
Figure 2. Curcumin absorption spectra before and after conjugation practice.
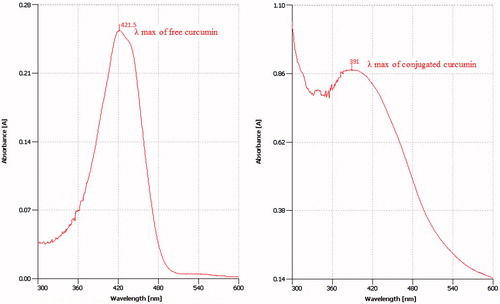
Table 1. Accuracy and precision data for UV spectrophotometric method of curcumin assay.
Table 2. Conjugation ratio and protein recovery with various curcumin: lactoferrin molar ratios.
Figure 3. Conjugation ratio trend versus Cur-Lf molar ratio.
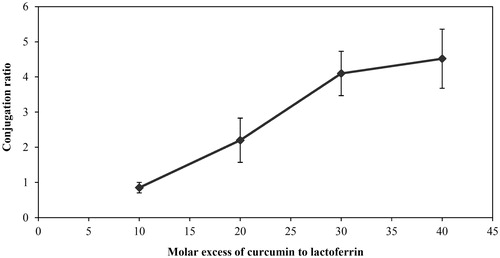
Figure 4. (A) Calibration curve of HPLC assay of curcumin. (B) Curcumin (A) and blank sample (B) chromatogram in HPLC assay of curcumin. As it is demonstrated, there is no peak in the retention time of curcumin in the blank sample (11 min).
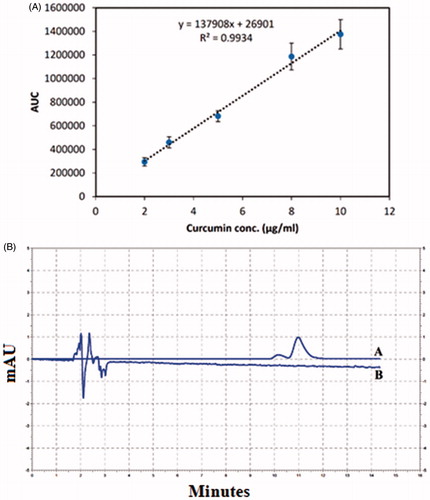
Table 3. Accuracy and precision data for HPLC assay of curcumin.
Figure 5. SDS-PAGE electrophoresis assay of conjugated samples by 40 times molar excess of curcumin. Bond “A” stands for conjugated curcumin, bond ”B” stands for free Lf and bond “C” demonstrates the mixture of curcumin and Lf.
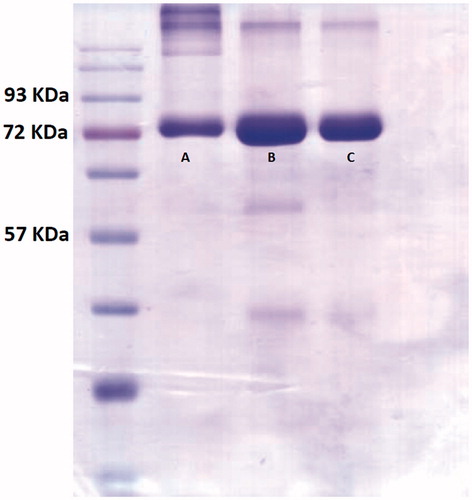
Figure 6. FESEM image of conjugated curcumin nano-structures.
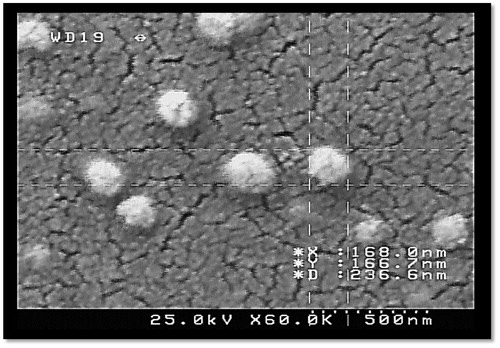
Figure 7. Effect of various concentrations of curcumin, Lf and conjugated curcumin on cell viability after 48 h and 72 h. Viability was determined as the percentage of living cells in treated cultures to control.
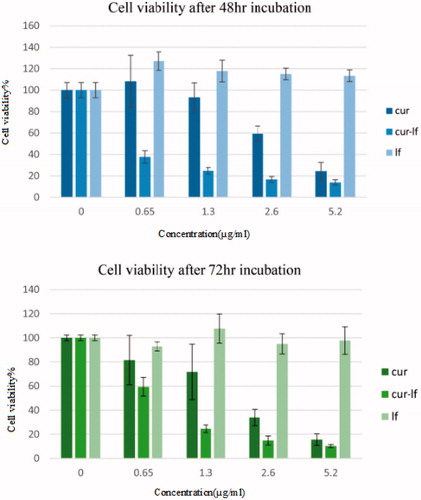
Figure 8. Cellular uptake of FITC-labelled conjugated nanostructure. (A) flow cytometry profile of control sample, (B) flow cytometry profile of conjugated sample, (C) fluorescence microscopy image of FITC-labelled conjugated nanostructure with DAPI used to stains cell nucleus.
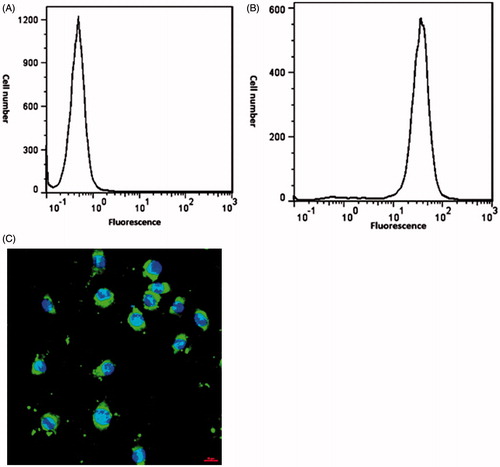
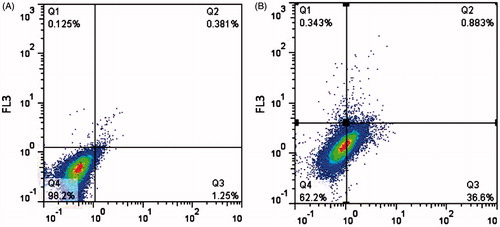
Figure 9. Apoptosis level measurement by flow cytometry. Apoptotic cells detected by flow cytometry with annexin VFITC/propidium iodide (PI). (A) Control cells, (B) treated cells with conjugated sample.