Figures & data
Figure 1. Molecular structure of Chr.
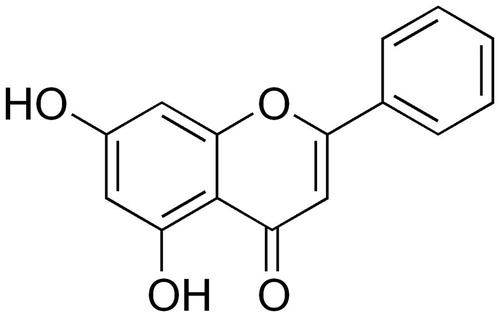
Figure 2. FE-SEM images of (A) 5% (B) 15% (w/w) Chr-loaded PCL/PEG nanofibers morphology.
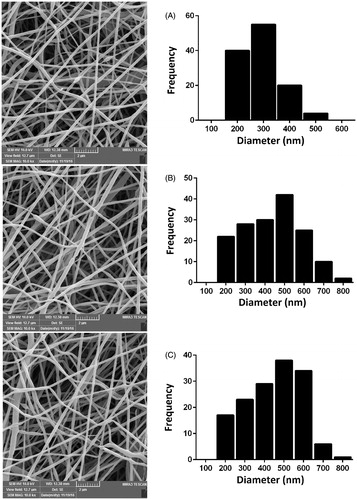
Figure 3. Infrared spectra of PCL/PEG, Chr and Chr-loaded PCL/PEG nanofibers.
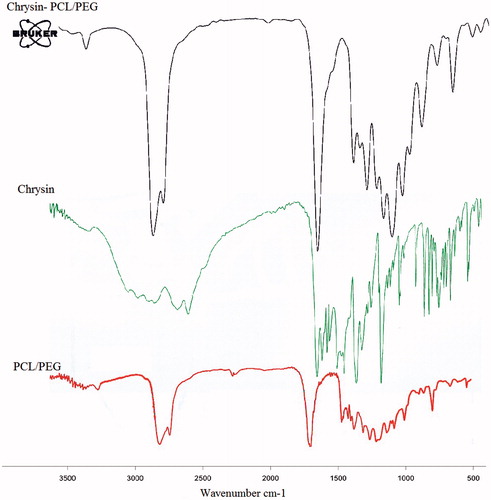
Table 1. The molecular weight of the PCL-PEG4000-PCL synthesized in this work.
Figure 4. Cumulative release of Chr from PCL/PEG nanofibers loaded with 5 and 15% (w/w) of Chr as a function of time. Significantly more Chr (*p ≤ .05) was released from the nanofibers having higher concentration of Chr after 8 h.
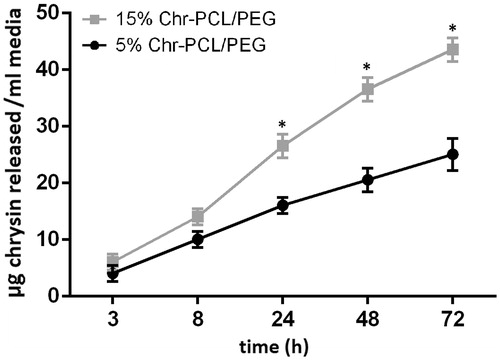
Figure 5. Cell viability assay of HFF-1 cells on PCL/PEG and Chr-loaded PCL/PEG nanofibers on days 1, 3, and 5. Values are expressed as mean ± SD of three parallel measurements. Viability was significantly reduced (*p ≤ .05) though more than 80% of cells were viable on both mats in 5-day culturing, suggesting the low cytotoxicity of Chr-loaded nanofibers.
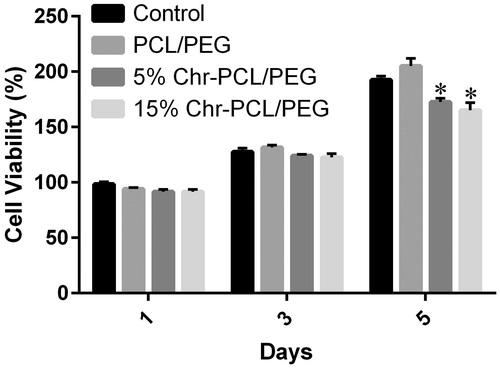
Figure 6. The morphology of HFF-1 cells attached to (A) PCL/PEG nanofibers, (B) 5% (w/w) Chr-loaded PCL/PEG nanofibers, and (C) 15% (w/w) Chr-loaded PCL/PEG nanofibers after 3-day culturing.
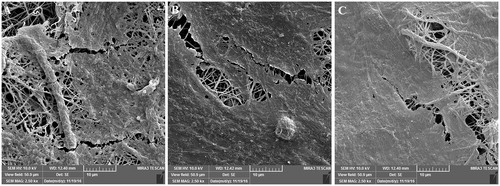
Figure 7. Oxygen Radical Absorbance Capacity (ORAC) assay for evaluating antioxidant activity of the nanofibers. Fluorescence quenching plotted as a function of time. Chr-loaded nanofibrous mats absorb free radicals and preserve fluorescence better than chrysin-free nanofibers and control.
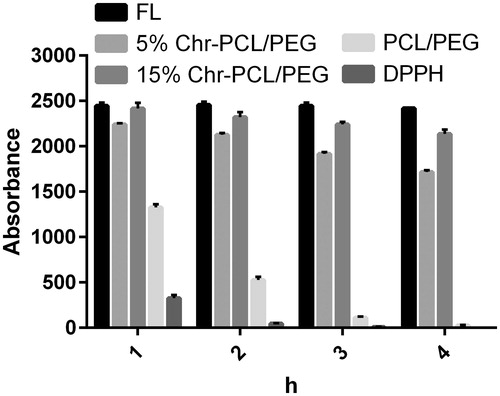
Figure 8. Viability of HFF-1 cells cultured in the presence and absence of 1% H2O2 on PCL/PEG nanofibers, 5 and 15% (w/w) Chr-loaded nanofibers. Viability was significantly reduced on PCL/PEG nanofibers lacking Chr due to oxidative stress (*p ≤ .05).
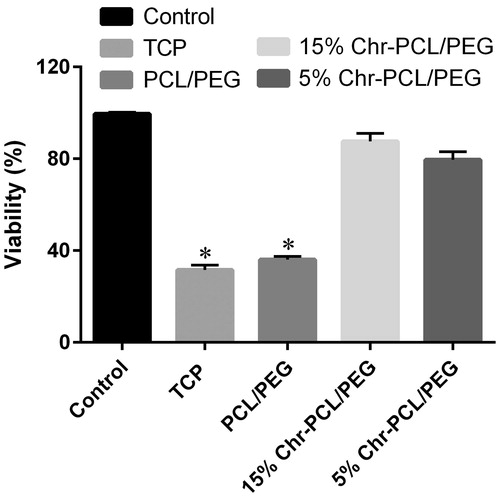
Figure 9. Anti-inflammatory effect of PCL/PEG and Chr-loaded PCL/PEG nanofibers evaluated on J774A1 cells stimulated with LPS. Histograms show the mean values of mRNA levels of (A) IL-6, (B) IL-1β and (C) TNF-α and the amount of (D) IL-6, (E) IL-1β (F) TNF-α after ELISA evaluation. (*p ≤ .05 vs. PCL/PEG and control groups; #p ≤ 0.05 vs. 5% (w/w) Chr-PCL/PEG nanofibers). Results are mean ± SD (n = 3).
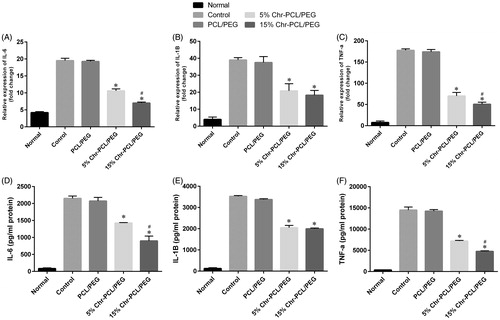
Table 2. In vitro anti-inflammatory effect of 5% and 15% (wt/wt) chrysin loaded into PCL/PEG nanofibers.
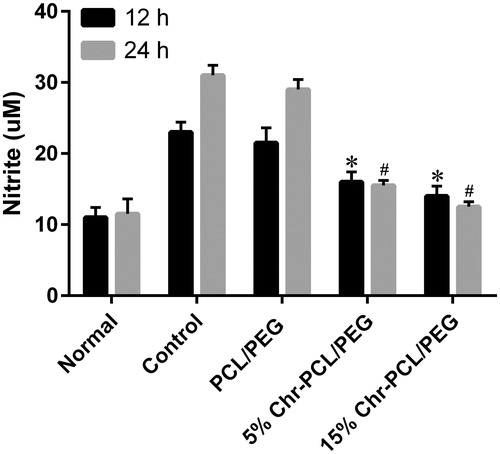
Figure 10. Effect of PCL/PEG and Chr-loaded PCL/PEG nanofibers on nitric oxide production in macrophage J774A1 cells. The J774A1 cells were incubated with LPS (1 μg/mL) and the nanofibers for 12 h and 24 h. (*p ≤ .05 vs. PCL/PEG and control groups at 12 h; #p ≤ .05 vs. PCL/PEG and control groups at 24 h). Results are mean ± SD (n = 3).