Figures & data
Scheme 1. Schematic representation of ZnO NPs bio-synthesis procedure and its antidiabetic application.
Figure 1. (a) XRD patterns and (b) EDX spectra of the ZnO samples prepared in water and aqueous solution of the extract.
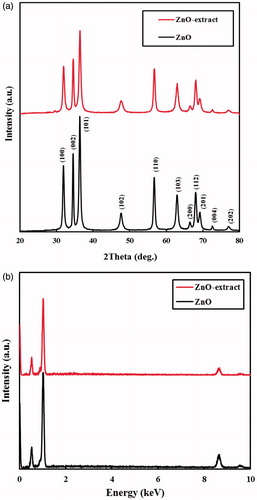
Figure 2. SEM images of the ZnO samples prepared in (a) water and (b) aqueous solution of the extract. TEM images of the ZnO samples prepared in (c) water and (d) aqueous solution of the extract.
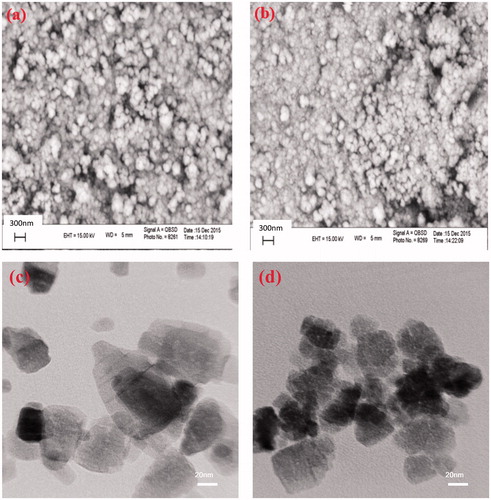
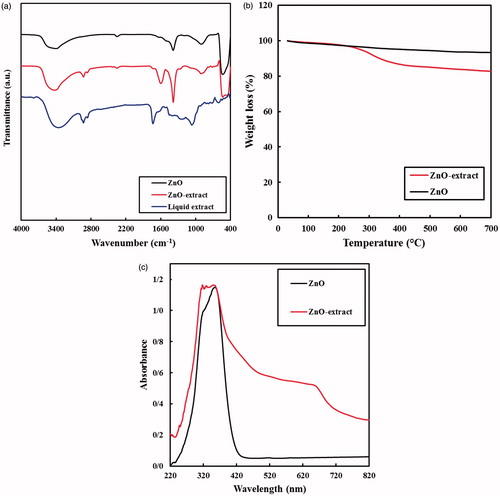
Figure 3. (a) FT-IR spectra, (b) TGA curves and (c) UV-vis DRS for the ZnO samples prepared in water and aqueous solution of the extract along with the liquid extract.
Scheme 2. Possible mechanism for bio-synthesis of ZnO NPs using Vaccinium arctostaphylos L fruit extract.
Table 1. FBS Levels in the studied groups during the experiments.
Figure 4. Insulin level in the studied groups during the experiments.
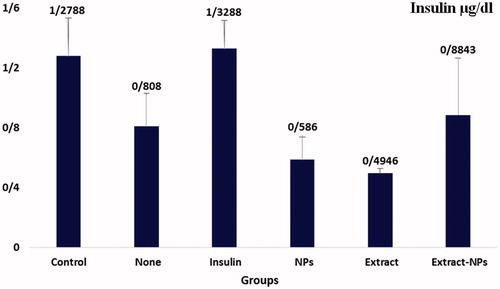
Figure 5. HDL level in the studied groups during the experiments.
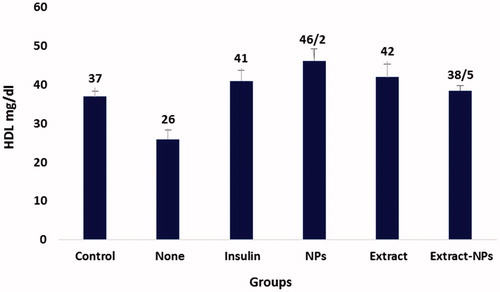
Figure 6. TG level in the studied groups during the experiments.
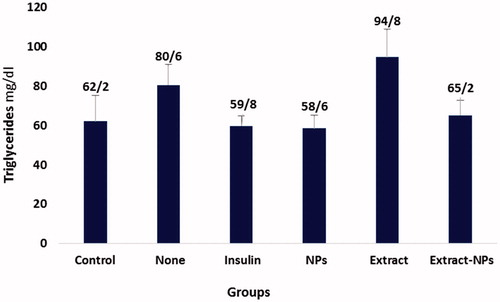
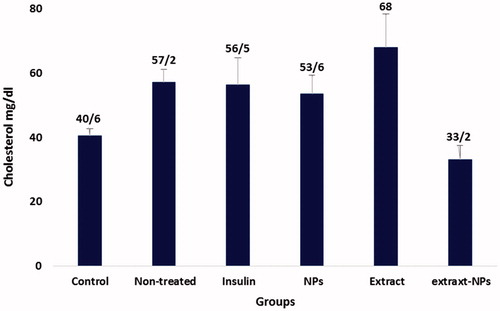
Figure 7. Cholesterol level in the studied groups during the experiments.