Figures & data
Table 1. Primer sequences used for real-time PCR (5′–3′).
Figure 1. Flowgram of CD34+ cord blood cells purity percentage after extraction with MACS.
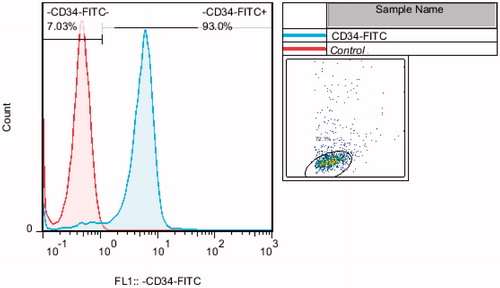
Figure 2. Scanning electron micrograph of polycaprolactone nano-fibre (original magnification A × 100, B × 1000). CD34+ cord blood cells culture in 2D medium (original magnification C × 400) were growing in PCL nano-fibre coated with fibronectin after 10 days (original magnification D × 1000).
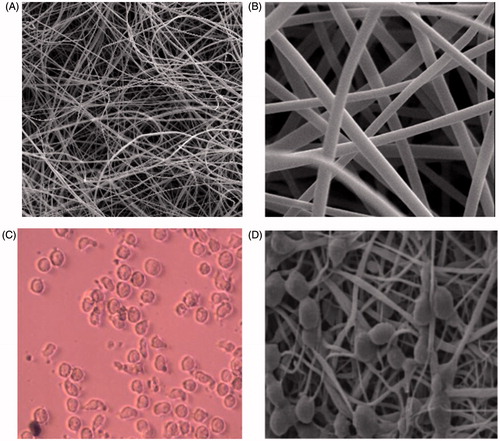
Figure 3. TNC fold expansion between 2D and 3D cell culture systems after 10 days culture.
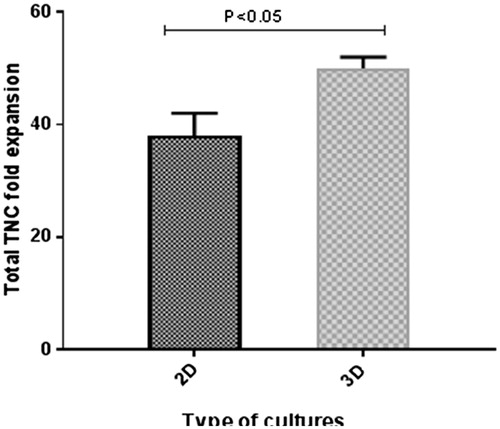
Figure 4. Total CD34+ cells fold expansion in 2D and 3D cell culture systems after 10 days culture.
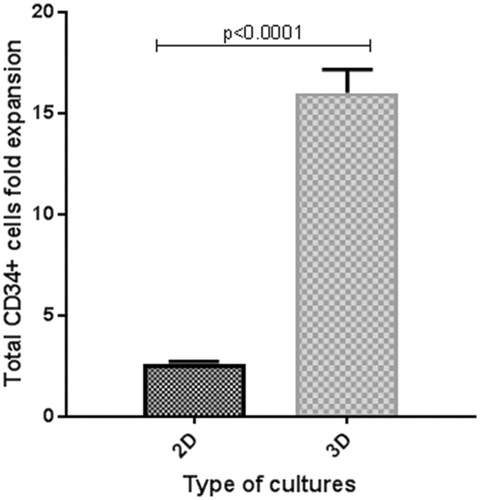
Table 2. Expression of surface markers on cells before and after expansion under different conditions.
Figure 5. Haematopoietic stem cell (CD34+), granulocytes (CD13 and CD33), lymphocytes (CD2, CD3 and CD19) and monocyte (CD14) markers in unexpanded cells immediately after extraction, 2D and 3D cell culture systems after 10 days expansion.
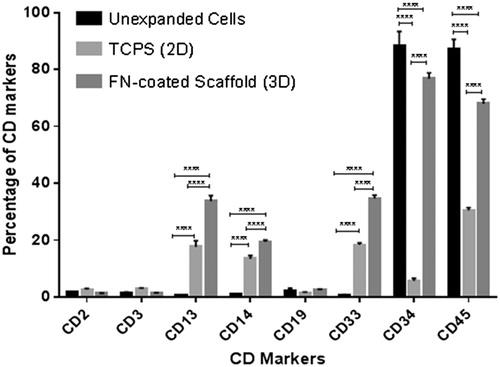
Figure 6. Image of BFU-E/CFU-E (A), CFU-GM (B) and CFU-GEMM (C) based on total CFU analysed for cells expanded in different culture system for 10 days.
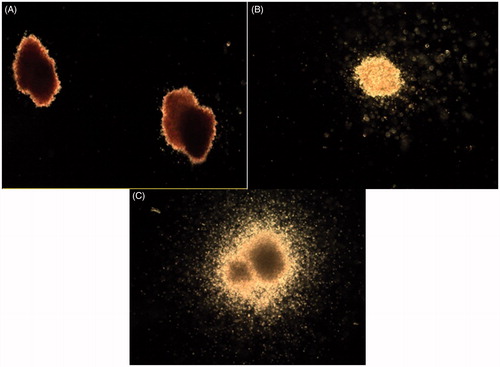
Figure 7. Number of different colony in unexpanded CD34+ cells (primary), 2D and 3D cell culture systems after 10 days culture.
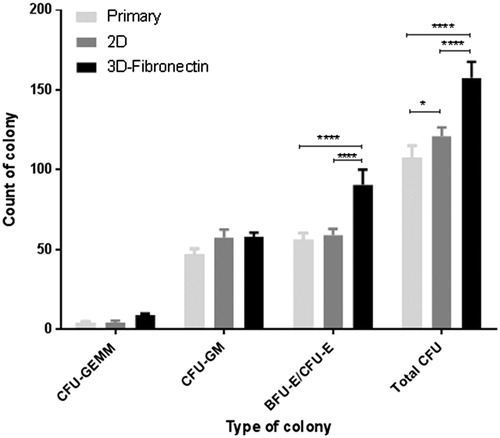
Table 3. Number of colony before and after expansion under different conditions.
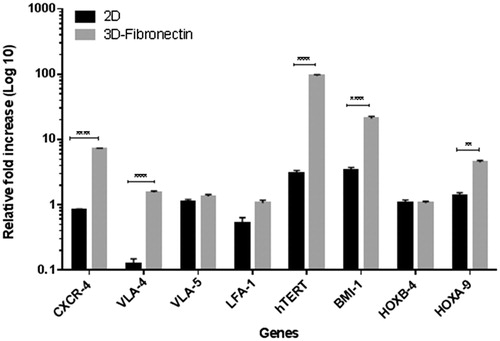
Figure 8. Relative fold increase homing and selfrenewality genes in 2D and 3D cell culture systems after 10 days culture compared to unexpanded cells.