
Figures & data
Figure 1. Scanning electron microscopy (SEM) photograph of nanoliposomes. Three-dimensional spheroids with smooth surface and uniform size vesicles were found in all images.
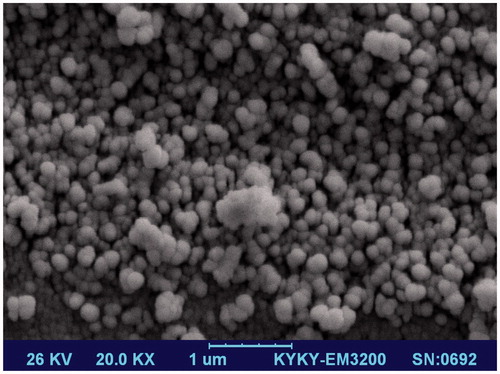
Figure 2. Release profile of BLM from liposomal and conventional formulations of BLM in phosphate buffered saline containing 10% foetal bovine serum (FBS) within 48 h at 37 °C. Data are presented as mean ± standard deviation (n = 3).
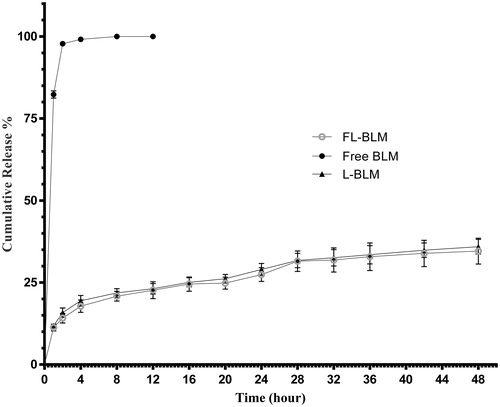
Table 1. Half maximal inhibitory concentration or IC50 values (μM) of different formulations of BLM against different cell lines.
Figure 3. Cellular uptake efficiency (CUE %) for evaluation of the effect of folate receptor on uptake of folate-conjugated nanoliposomes. The competitive inhibitory effect of free folate on cellular uptake of FL-BLM by HeLa cells (C).
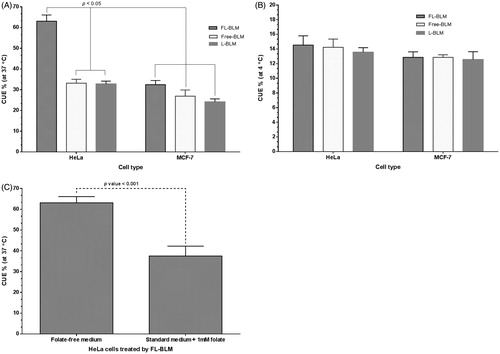
Table 2. Effect of FR-targeted nanoliposomes on cell cycle progression of HeLa cells after 48 h incubation in folate-free medium.
Figure 4. Flow cytometric analysis to study the effect of folate-targeted nanoliposomes to induce apoptosis in HeLa cells. (A) Dot plot of HeLa cells treated by PBS for 48 h (control), (B) dot plot of HeLa cells treated by conventional-BLM for 48 h and (C) dot plot of HeLa cells treated by FL-BLM.
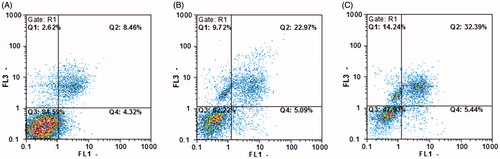
Table 3. Percentage of HeLa cells in each state after treatment with different formulations of BLM at 2 μM concentration and 48 h of incubation.