
Figures & data
Figure 1. UV–Vis spectral analysis of Punica granatum leaf extract (PGE) and synthesized PGE-AgNPs after incubation at room temperature for 20 min (inset is the digital photographs of the corresponding AgNPs).
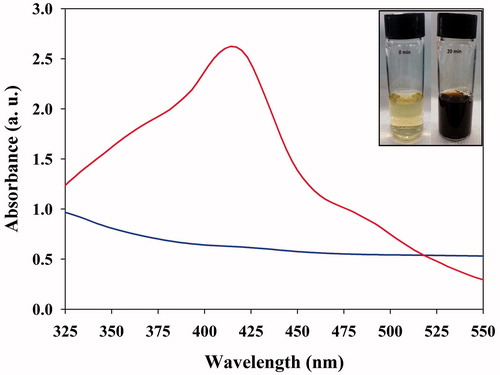
Figure 2. Schematic representation of the synthesis, capping and stabilization of AgNPs using Punica granatum leaf extract.
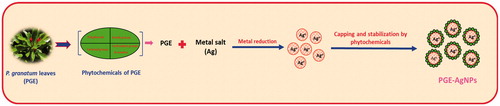
Figure 3. XRD pattern of the synthesized PGE-AgNPs.
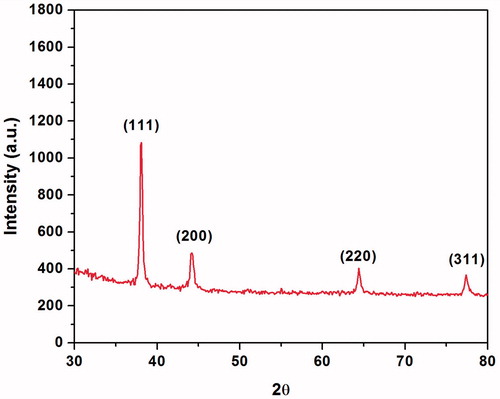
Figure 4. XPS spectra of (A) Survey and (B) Ag 3d of the synthesized PGE-AgNPs.
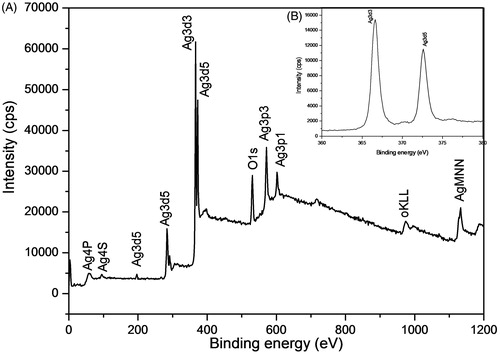
Figure 5. FTIR spectra of Punica granatum leaf extract (PGE) and synthesized PGE-AgNPs.
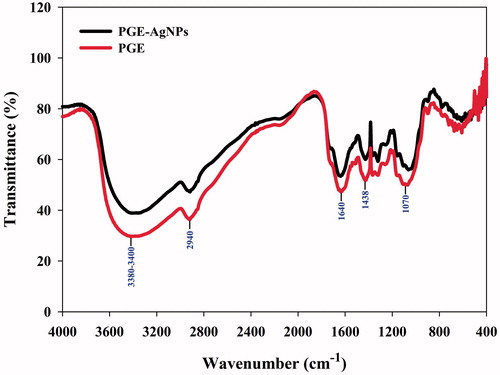
Figure 6. (A) FESEM images and (B) EDS spectrum of synthesized PGE-AgNPs.
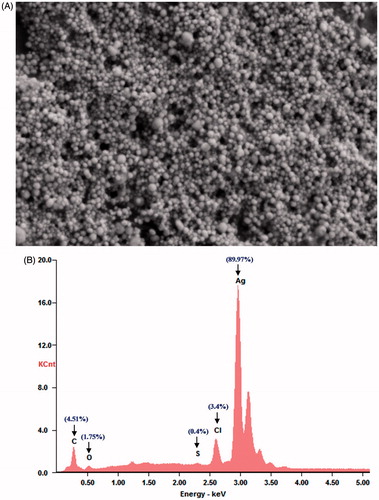
Figure 7. (A) HRTEM micrographs of PGE-AgNPs and (B) SAED results illustrating the formation of AgNPs.
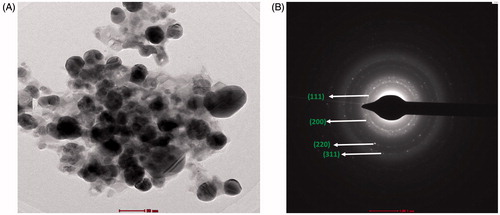
Figure 8. Stability of synthesized PGE-AgNPs up to 6 months and their (A) SPR spectrum, (B) zeta potential and (C) particle size distribution determined by DLS.
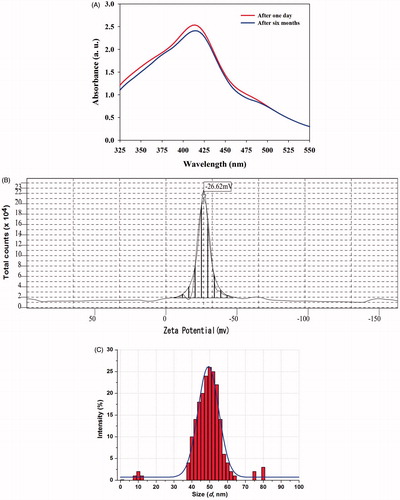
Figure 9. Antidiabetic activity of synthesized PGE-AgNPs based on inhibition of α-amylase and α-glucosidase activity.
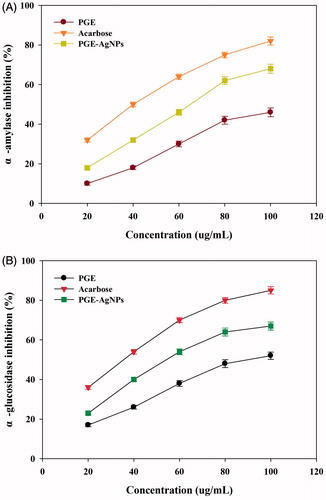
Figure 10. Anticancer activity of various concentrations of synthesized PGE-AgNPs against the liver cancer cell line- HepG2 (within each tested dose, different letters above each column indicate significant differences).
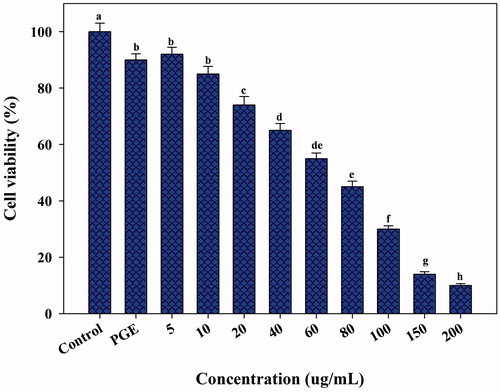
Figure 11. Antioxidant activity of synthesized PGE-AgNPs based on DPPH and ABTS radical-scavenging activities.
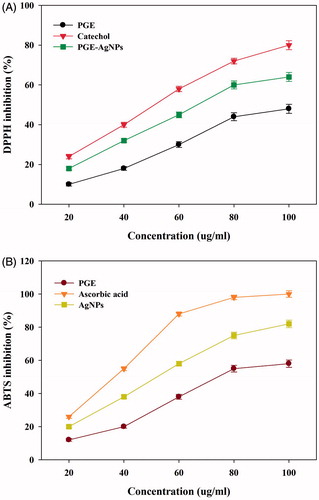
Table 1. Enhanced antibacterial activity of punica granatum leaf extract synthesized silver nanoparticles (AgNPs) against Escherichia coli and Staphylococcus aureus.