Figures & data
Figure 1. HPLC chromatograms of GOD–PEG aldehyde conjugate (nGOD/nPEG 1:20) and free GOD.
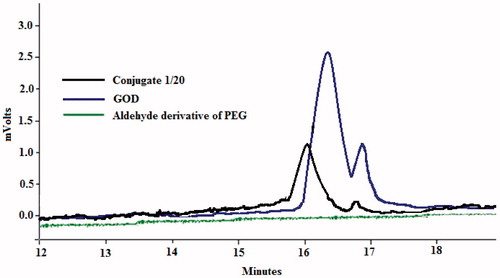
Figure 2. Changes in FAD fluorescence intensities of native GOD and a GOD–PEG aldehyde conjugate (nGOD/nPEG 1:5) depending on time at 60 °C for different pH values, λex= 400 nm, λem= 500 nm; pH 4 (A), pH 5 (B), pH 6 (C), pH 7 (D), pH 8 (E).
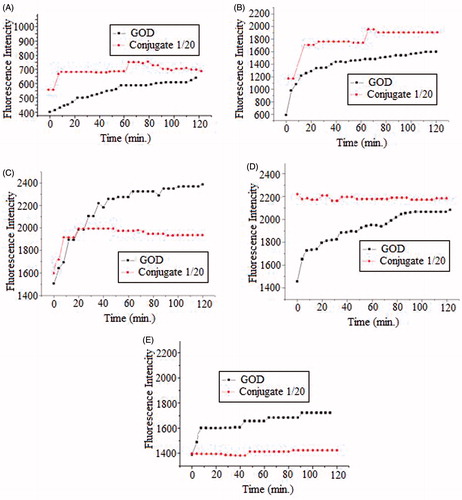
Figure 3. Thermal inactivation of the native and the conjugates (nGOD/nPEG 1:1; nGOD/nPEG 1:5) which incubated at 60 °C for different time.
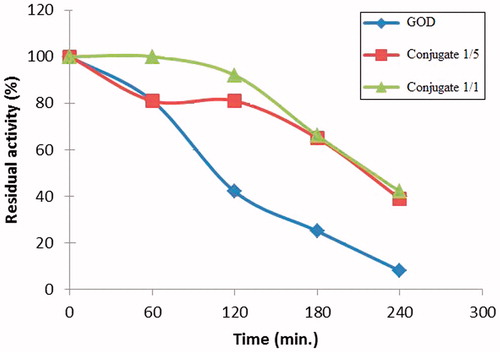
Figure 4. Activities of native GOD and GOD–PEG aldehyde conjugate with different molar ratios (nGOD/nPEG 1/1, 1/5, 1/10, 1/20) depending on pH at 30 °C.
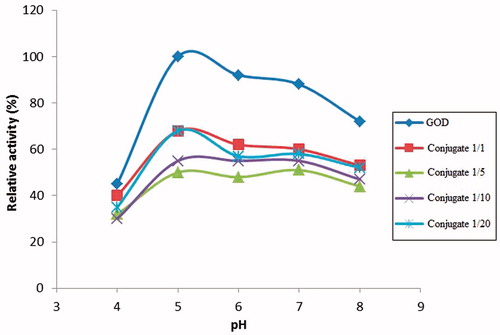
Figure 5. Thermal stabilities of GOD–PEG aldehyde conjugates with different molar ratios (nGOD/nPEG 1/1, 1/5, 1/10, 1/20) at pH 5.
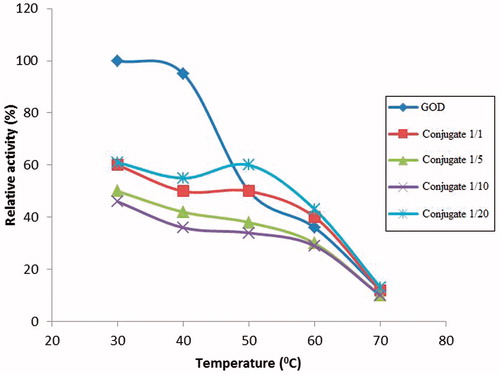
Table 1. The kinetic parameters of the oxidation of glucose by GOD at pH 5.0.
Figure 6. SPM images of the free GOD (A) and modified GOD with PEG aldehyde (nE/nD:1/5) (B).
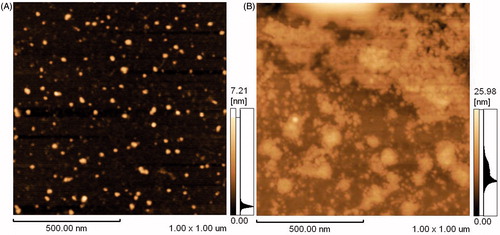
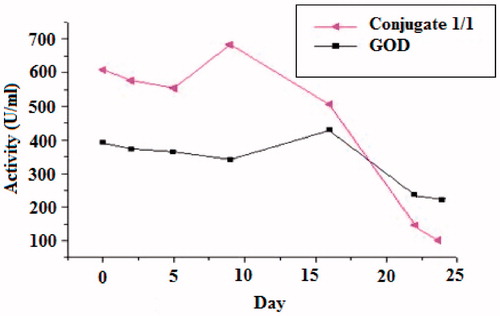
Figure 7. Storage stabilities of native and modified GOD with PEG aldehyde storage at 4 °C temperature.