Figures & data
Figure 1. (a) UV-vis spectral plot of AgNP-E. scaber synthesised by microwave irradiation, the photograph in the inset shows the colour change on nanoparticles formation, (b) FT-IR spectra of (1) E. scaber and (2) AgNP- E. scaber.
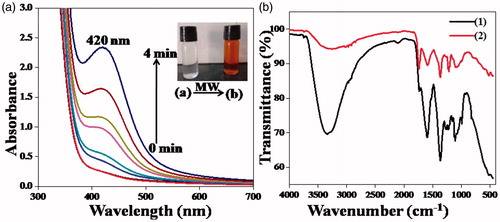
Figure 2. The photoluminescence spectra of AgNP-E. scaber (a) excitation spectrum, (b) emission spectrum under an excitation of 360 nm, (c) emission spectrum under an excitation of 450 nm and (d) The powder XRD pattern of AgNP-E. scaber.
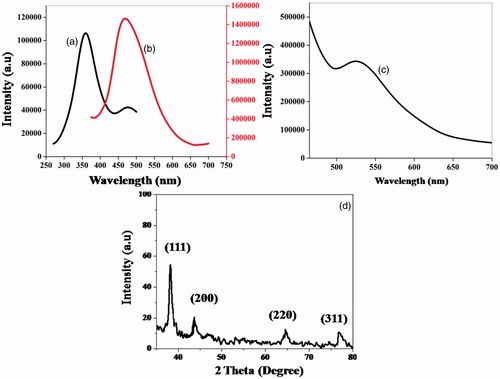
Figure 3. (a–e) TEM images of different magnifications, (f) HR-TEM image, (g) SAED pattern, (h) EDX spectrum, (i) particles’ size distribution, (j) and (k) AFM images of AgNP-E. scaber.
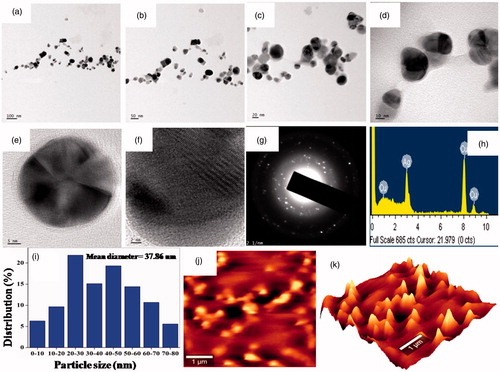
Figure 4. Time-based UV-vis spectral images for the reduction of (a) 4-nitrophenol (b) 2-nitroaniline and (c) 4-nitro anilines by NaBH4 catalyzed by AgNP-E. scaber (0.02 mg/mL). ln [a] against time plots are shown in the inset.
![Figure 4. Time-based UV-vis spectral images for the reduction of (a) 4-nitrophenol (b) 2-nitroaniline and (c) 4-nitro anilines by NaBH4 catalyzed by AgNP-E. scaber (0.02 mg/mL). ln [a] against time plots are shown in the inset.](/cms/asset/8bb2ec43-32a1-4767-bcad-e65f965b3844/ianb_a_1345921_f0004_c.jpg)
Figure 5. UV- vis spectra and ln [A] versus time plot for the degradation of eosin Y using NaBH4 catalyzed by AgNP-E. scaber (0.02 mg/mL).
![Figure 5. UV- vis spectra and ln [A] versus time plot for the degradation of eosin Y using NaBH4 catalyzed by AgNP-E. scaber (0.02 mg/mL).](/cms/asset/69e82895-8d50-46a8-a9ca-835dc688e205/ianb_a_1345921_f0005_c.jpg)
Figure 6. Antioxidant capacity of E. scaber and AgNP-E. scaber (12.5, 25, 50, 100 and 200 μg/mL) evaluated using DPPH assay. The values are given as the mean ± SD (n = 3).
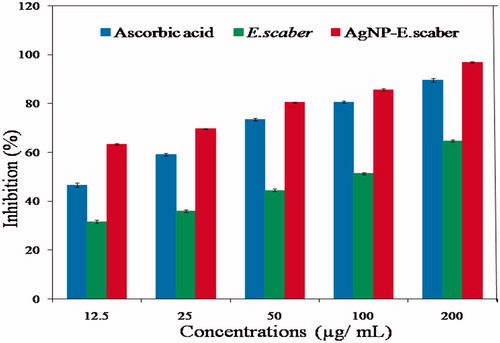
Figure 7. (a) Photographs of the tested antimicrobial plates, where A= 50 μL of E. scaber (0.05 mg/mL), B = 50 μL of AgNP-E. scaber (1 mg/mL), C= 70 μL of AgNP-E. scaber (1 mg/mL), D= 50 μL of Streptomycin/Griseofulvin (10 mg/mL), E = 50 μL of Millipore water (b) Zone of inhibition in mm for the antibacterial and antifungal studies. The values are expressed as mean ± SD (n = 6).
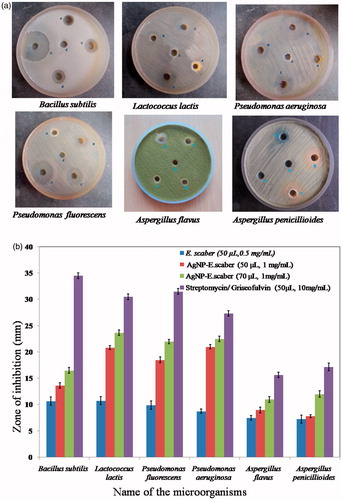
Figure 8. Morphological changes induced on (a) treated A375 cells by aqueous leaf extract of E. scaber, (b) treated L929 cells by AgNP-E. scaber (c) treated A375 cells by AgNP-E. scaber observed by inverted phase contrast tissue culture microscope after an incubation period of 48 h.
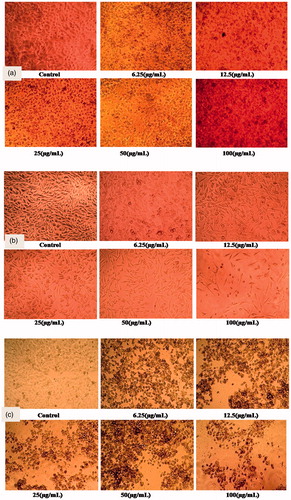
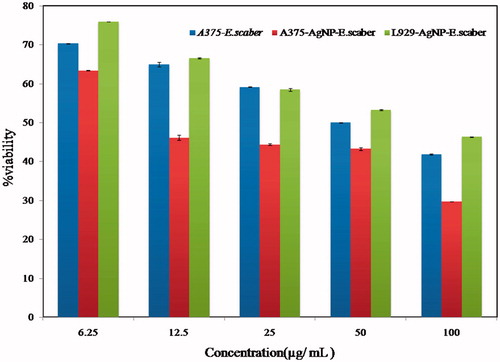
Figure 9. Cell viability (%) plot of E. scaber leaf extract and AgNP-E. scaber towards A375 and L929 cells. The plotted values are the mean ± SD (n = 3).