
Figures & data
Table 1. Clinicopathological characteristics of 97 patients with glioma.
Figure 1. qRT-PCR detection of relative miR-133b expression in glioma tissues and normal brain tissues.
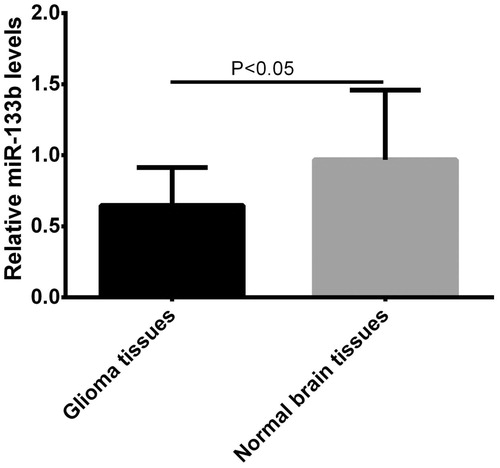
Figure 2. Kaplan–Meier curve for overall survival in glioma patients with low versus high miR-133b expression.
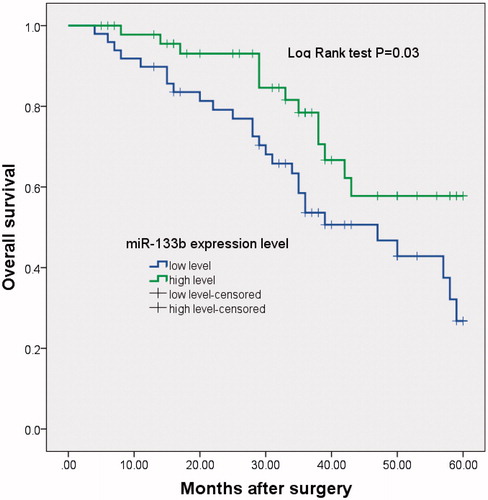
Table 2. Multivariate analysis for overall survival in 97 patients with glioma.