
Figures & data
Table 1. Description of primer sets used in qPCR for gene expression analyses.
Table 2. Antioxidant activity of WE-loaded PCL/PEG nanofibers (n = 3).
Figure 1. SEM images of fabricated nanofibers, PCL-PEG (A), WE-PCL-PEG (B and C).
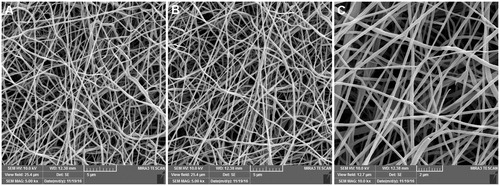
Figure 2. FTIR spectra of WE, PCL-PEG and WE-PCL-PEG nanofibers.
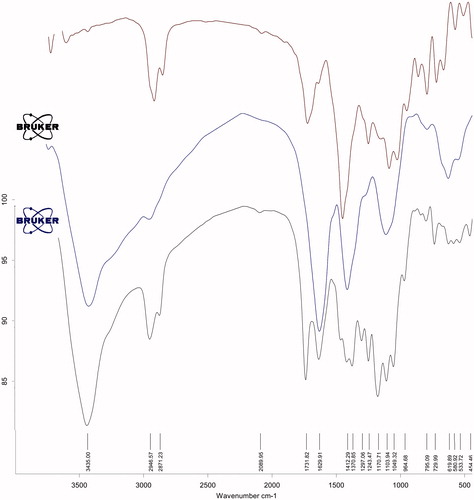
Figure 3. Cell viability of ADSCs grown PCL-PEG nanofibers, WE-PCL-PEG nanofibers and tissue culture plates (TCPs) after 1, 7 and 14 days of cell culture. *p < .05. Values are expressed as mean ± SD of three parallel measurements.
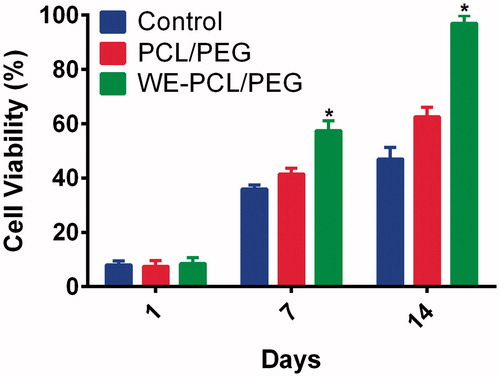
Figure 4. FE-SEM images of ADSCs morphology on the PCL-PEG nanofibers (A, B, C) and WE-loaded PCL-PEG nanofibers (D, E, F) after 7 and 14 days of seeding.
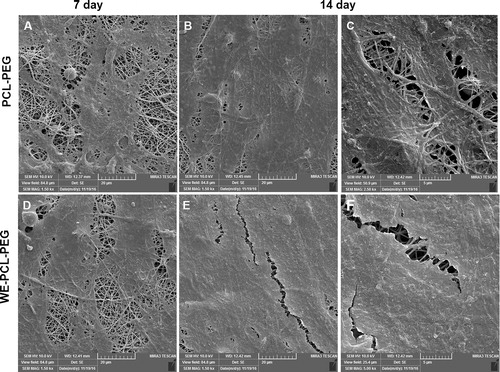
Figure 5. Viability of ADSCs cultured in the presence and absence of 1% H2O2 on PCL-PEG nanofibers and WE-loaded PCL-PEG nanofibers. Viability was significantly reduced on PCL-PEG nanofibers lacking WE due to oxidative stress (* p ≤ 0.05). Results are mean ± SD (n = 3).
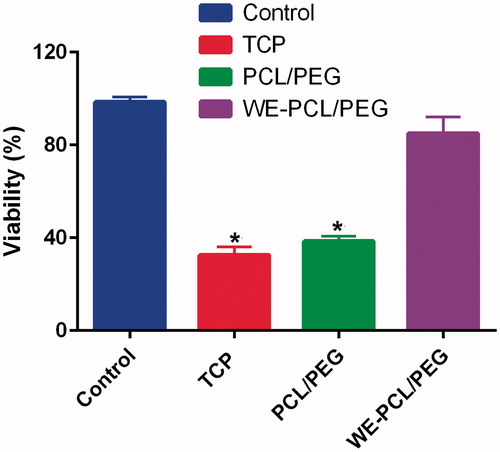
Figure 6. DNA content of of ADSCs cultured on control PCL-PEG nanofibers (A) and WE-PCL-PEG nanofibers (B). Results are mean ± SD (n = 3).
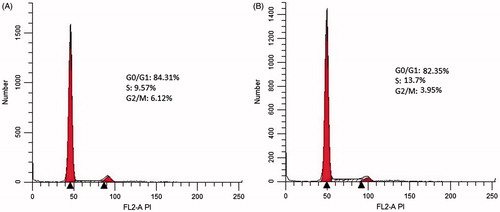
Table 3. Percentage of cells at various cell phases (values are expressed in mean ± SD).
Figure 7. The expression levels of cell cycle–regulated genes (Cyclin D1, pRb and p53) were investigated by qRT-PCR in ADSCs cultured on PCL-PEG nanofibers, WE-PCL-PEG nanofibers and control (without scaffold) for 7 and 14 days. The cell cycle–regulated genes were significantly up-regulated in WE-loaded PCL-PEG nanofibers as compared to PCL-PEG (*p < .05). Results are mean ± SD (n = 3).
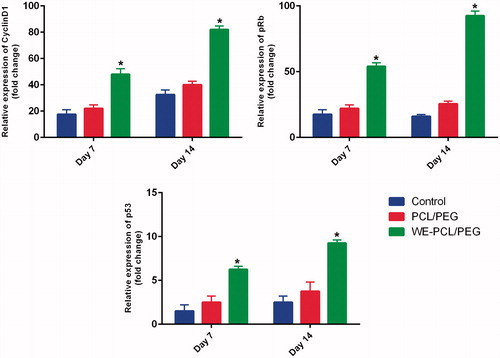
Figure 8. The expression of Oct-4, Rex-1, Sox-2 and Nanog3 genes were investigated by qRT-PCR in cultured on PCL-PEG scaffold, WE-PCL-PEG and control (without scaffold). GAPDH gene was used as internal control. All stemness marker genes, were significantly up-regulated in WE-loaded PCL-PEG nanofibers as compared to PCL-PEG (* p < .05). Results are mean ± SD (n = 3).
