Figures & data
Figure 1. miR-26a was significantly decreased in filtering tract scar. (A) The miR-26a was significantly down-regulated in filtering tract scar tissues. (B) miR-26a was inversely correlated with CTGF mRNA level. Graph represents the 2-ΔΔCt values ± SD, *P < .05, ***P < .001.
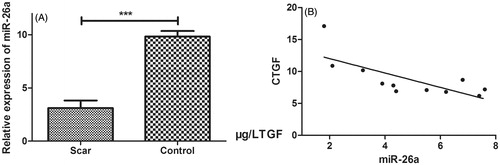
Figure 2. TGF-β treatment increased the cell viability and proliferation. (A) The cell viability was detected by TGF-β in 0.1, 1, 2, 5, 10, 20, 100 μg/L and TGF-β in 1, 2, 5, 10, 20 and 100 μg/L could improve cell viability significantly. (B) TGF-β treatment for over 4 days, the proliferation rate increased significantly. *P < .05, ***P < .001).
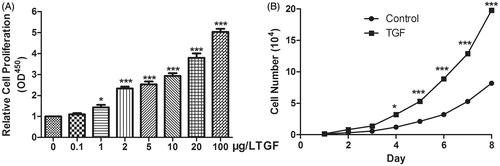
Figure 3. Overexpression of miR-26a inhibits HTFs fibrosis in vitro model. The cell viability was determined in HTFs fibrosis in vitro model transfected with miR-2ba precursor or negative control. A450 absorption was assayed after transfection for 24 h. ***P < .001.
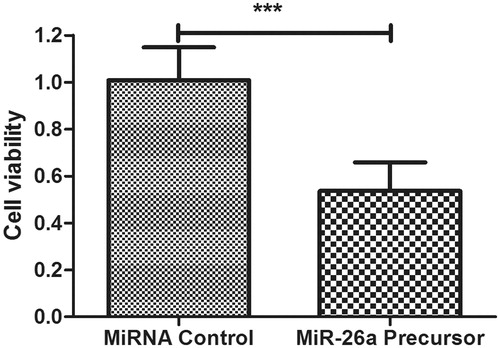
Figure 4. miR-26a inhibited migration of HTFs fibrosis in vitro model. (A) Cell migration ability was analysed by transwell chamber assay 24 h after miR-26a or NC transfection. (B) Quantification of the migratory cells by solubilization of crystal violet. Data represented mean ± SD. ***P < .001.
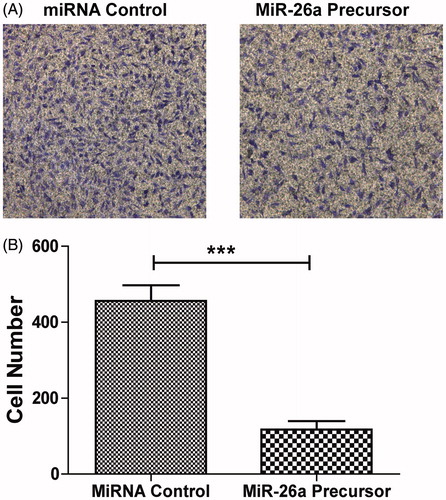
Figure 5. miR-26a decreased apoptosis of HTFs fibrosis in vitro model. Cells in each group were collected and stained with Annexin-V/PI. The percentages of early (low right quadrant) and late apoptotic cells (upper right quadrant) were assessed by flow cytometry. (A). flow cytometry plot of control mRNA. (B) flow cytometry plot of miR-26a. (C) percentages of early and late apoptotic cells. Data represented mean ± SD. *** P < .001.
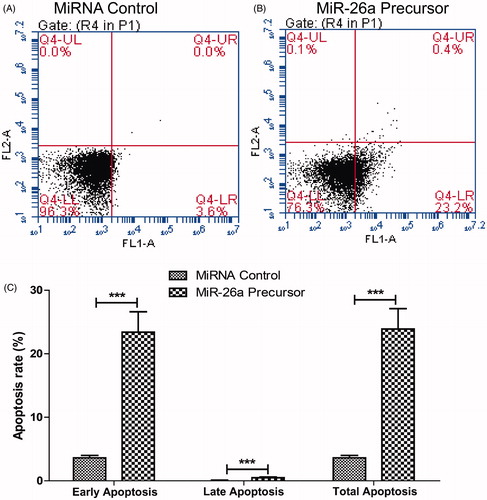
Figure 6. miR-26a inhibited CTGF expression. Western blotting analysis of CTGF protein level. GAPDH was used as a loading control.
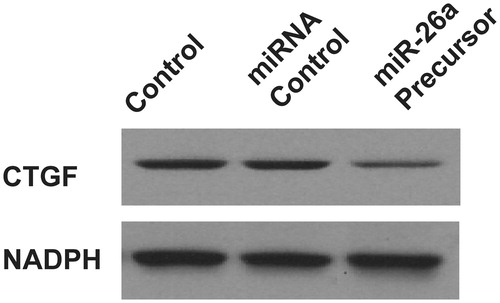
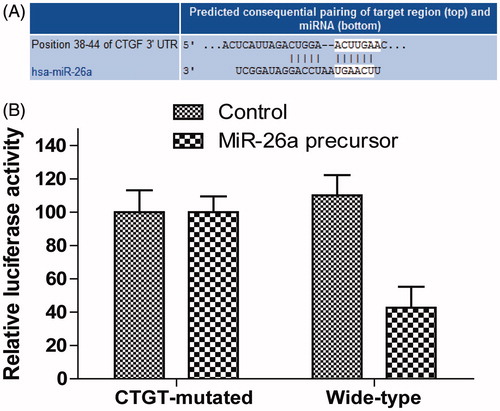
Figure 7. miR-26a directly targets the CTGF in HTFs fibrosis cell model. (A) Computer prediction of miR-26a-binding sites in the 3′-UTRs. (B) wild-type 3′-UTR-reporter or mutant constructs together with miR-26a precursor or controls. Data represented mean ± SD, P < .05.