Figures & data
Table 1. Human primers used in real time RT-PCR studies.
Figure 1. Morphology of polyethersulfone nanofibers (×5000). (A) Collagen-coated aligned polyethersulfon, (B) Collagen-coated random polyethersulfon.
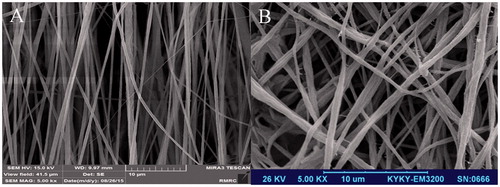
Figure 2. (A) SEM analysis of iPSCs culture on aligned PES/COL nanofibers before differentiation. (B) SEM analysis of iPSCs culture on aligned PES/COL nanofibers after 20 days of differentiation.
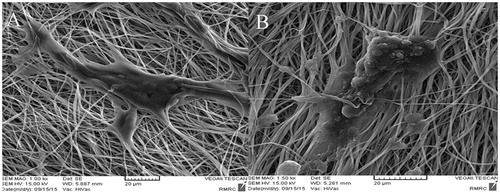
Figure 3. MTT cell proliferation assay of iPSCs on collagen-coated random and aligned polyethersulfone scaffold and tissue culture polystyrene (TCPS) during 1, 2, 3 and 4 days of culture (asterisks show significant difference between the groups at p < .05).
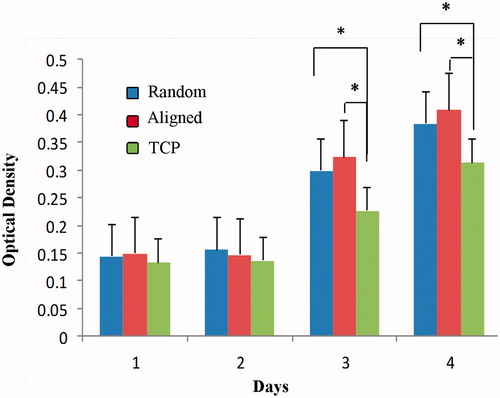
Figure 4. The immunochemical analysis of differentiated iPSc after 5 days for Foxa2 marker on random (A) and aligned (B) nanofibers with nuclear counterstaining (DAPI).
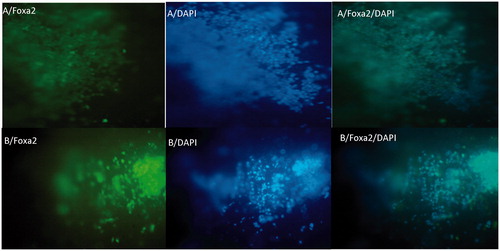
Figure 5. The immunochemical analysis of differentiated iPSc after 5 days for Sox17 markers on random (A) and aligned (B) nanofibers with nuclear counterstaining (DAPI).
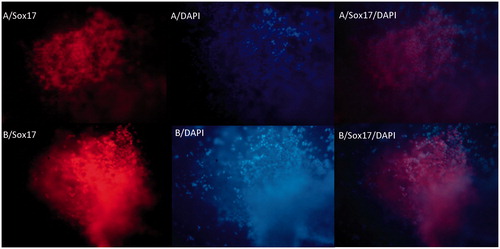
Figure 6. Real time RT-PCR analyses of the expressions level of definitive endoderm genes at day 5 after differentiation of iPSc on aligned PES nanofibers. The expression levels were normalized to control (random nanofibers) group.
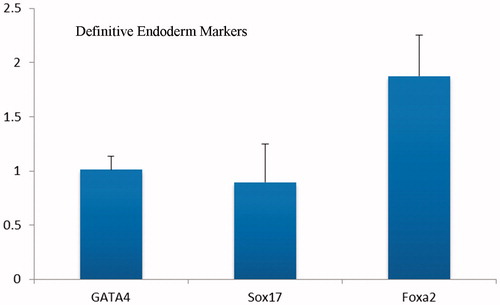
Figure 7. The immunocytochemical analysis of differentiated iPSCs on day 20 for Albumin marker on random (A) and aligned (B) nanofibers with nuclear counterstaining (DAPI).
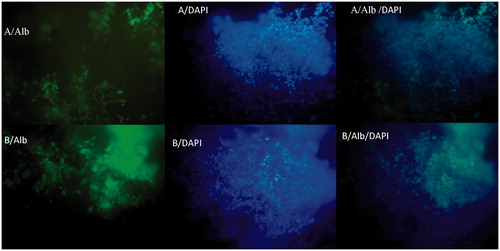
Figure 8. Quantitative RT-PCR analyses of the expressions level of hepatic cell genes at day 20 after hepatogenic differentiation of iPSc on collagen-grafted PES nanofibers. The expression levels were normalized to random nanofiber as a control group.
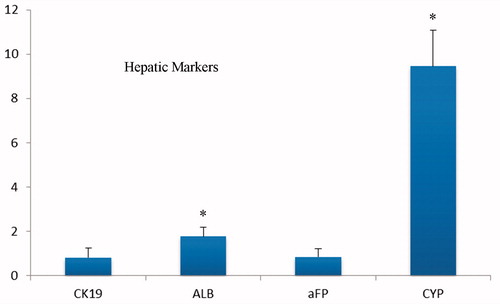
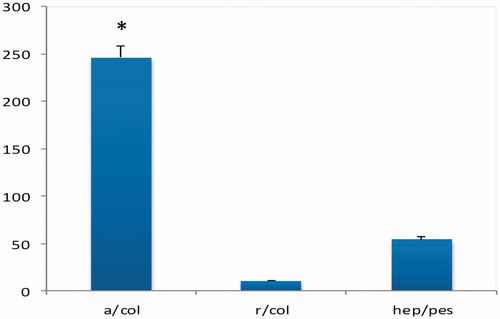
Figure 9. Quantification of albumin produced in hiPSCs after 28 days of hepatic lineage induction compare with undifferentiated hiPSCs and hepG2 as a positivie control.