Figures & data
Figure 1. (a) Photograph of plant Indigofera tinctoria, (b) (1) Photograph of Indigofera tinctoria leaf extract, (2) silver nanoparticles (AgNP- tinctoria), and (3) gold nanoparticles (AuNP- tinctoria), (c) UV-vis. spectrum of AgNP- tinctoria, and (d) UV-vis. spectrum of AuNP- tinctoria.
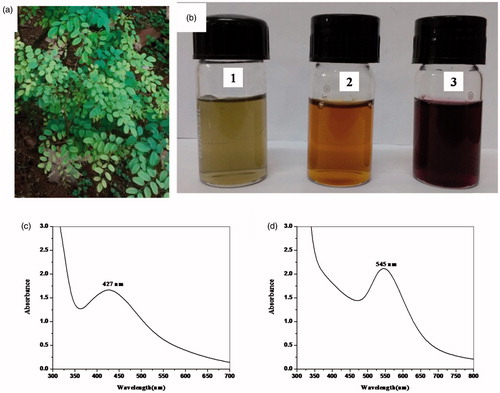
Figure 2. (a) FTIR spectrum of (1) Indigofera tinctoria leaf extract, (2) AgNP- tinctoria, and (3) AuNP- tinctoria (c) XRD pattern of AgNP- tinctoria, and (d) XRD pattern of AuNP- tinctoria
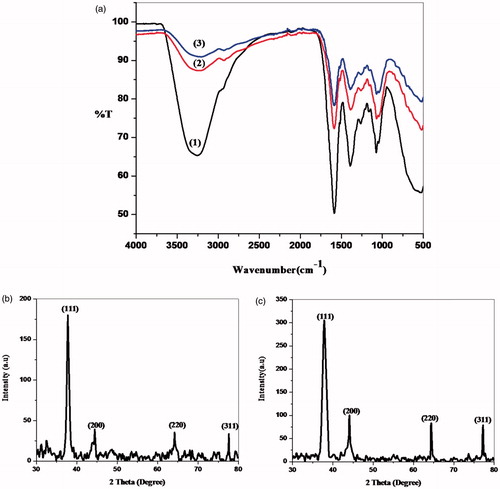
Figure 3. (a, b and c) TEM images of AgNP- tinctoria, at different magnification, (d) HR-TEM image of AgNP- tinctoria, (e) SAED pattern of AgNP- tinctoria, and (f) particle size distribution histogram of AgNP- tinctoria, (g) EDX Spectrum of AgNP- tinctoria, (h, i and j) TEM images of AuNP- tinctoria, at different magnification (k) SAED pattern of AuNP- tinctoria, (l) HR-TEM image of AuNP- tinctoria, and (m) particle size distribution histogram of AuNP- tinctoria, and (n) EDX Spectrum of AuNP- tinctoria.
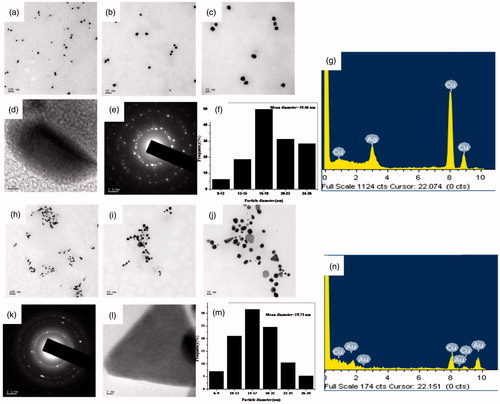
Figure 4. (a) Morphological changes induced on treated A549 cancer cell by (a) Indigofera tinctoria, (b) AgNP- tinctoria, and (c) AuNP- tinctoria, and (d) Cytotoxicity studies for Indigofera tinctoria leaf extract, AgNP- tinctoria, and AuNP- tinctoria towards A549 cancer cells.
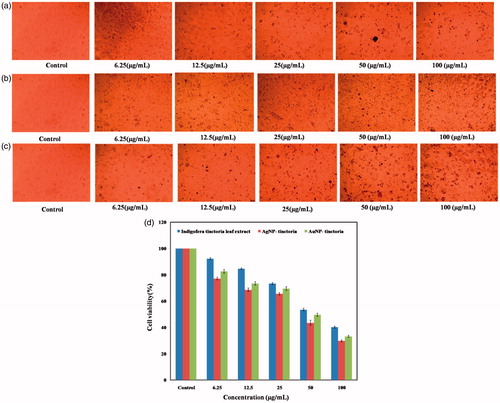
Table 1. The results of ANOVA and Tukey’s test (for anticancer studies).
Figure 5. (a) Illustration of the antimicrobial activity of AgNP- tinctoria and AuNP- tinctoria against various human pathogenic microorganisms using agar well diffusion method. [(A) Control, (B) Indigofera tinctoria leaf extract, (C) AuNP- tinctoria, and (D) AgNP- tinctoria] (b) Bar diagram showing zone of inhibitions (mm) of Indigofera tinctoria leaf extract, AgNP- tinctoria, and AuNP- tinctoria and (c) Antioxidant activities of AgNP- tinctoria, AuNP- tinctoria, and Indigofera tinctoria extract compared to ascorbic acid.
![Figure 5. (a) Illustration of the antimicrobial activity of AgNP- tinctoria and AuNP- tinctoria against various human pathogenic microorganisms using agar well diffusion method. [(A) Control, (B) Indigofera tinctoria leaf extract, (C) AuNP- tinctoria, and (D) AgNP- tinctoria] (b) Bar diagram showing zone of inhibitions (mm) of Indigofera tinctoria leaf extract, AgNP- tinctoria, and AuNP- tinctoria and (c) Antioxidant activities of AgNP- tinctoria, AuNP- tinctoria, and Indigofera tinctoria extract compared to ascorbic acid.](/cms/asset/bd057259-c666-49dd-acb4-762da62e769e/ianb_a_1345930_f0005_c.jpg)
Table 2. The results of ANOVA and Tukey’s test (for antioxidant studies).
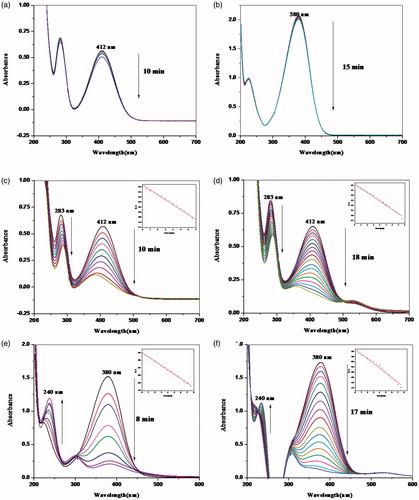
Figure 6. (a) and (b) Reduction reactions of o-nitroaniline and, p-nitroaniline using NaBH4 without nanocatalysts; (c) and (d) reduction reactions of o-nitro aniline using AgNP-tinctoria and AuNP-tinctoria nanocatalysts; (e) and (f) reduction of p-nitroaniline using AgNP-tinctoria, and AuNP-tinctoria nanocatalysts.