
Figures & data
Figure 1. HNMR spectrum of PCL–PEG–PCL copolymer.
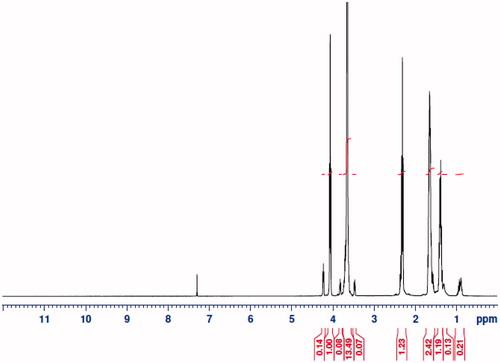
Figure 2. FT-IR spectrum of PCL–PEG–PCL copolymer.
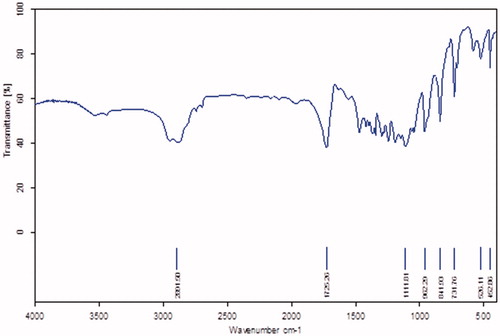
Figure 3. DSC thermogram of PCL–PEG–PCL copolymer.
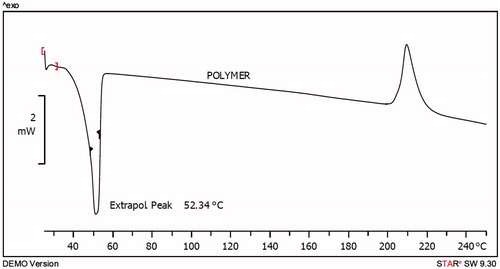
Table 1. Molecular characteristics of the synthesized copolymers.
Figure 4. AFM image of ART loaded spherical core shell micelles.
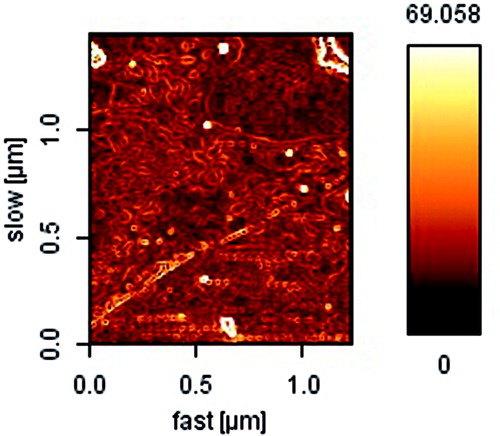
Figure 5. Particle size distribution and zeta potential of ART/PCL–PEG–PCL.
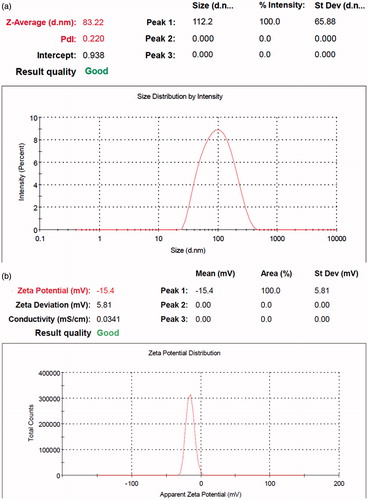
Table 2. Properties of ART/PCL–PEG–PCL micelles.
Figure 6. The average hydrodynamic diameter of PCL–PEG–PCL copolymer.
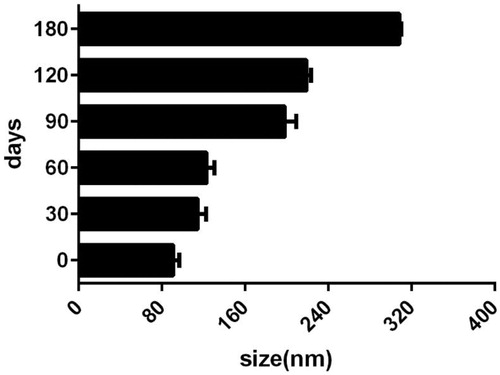
Figure 7. The release profiles of ART from ART/PCL–PEG–PCL micelles in different release media (pH = 7.4, plasma, pH = 5.5).
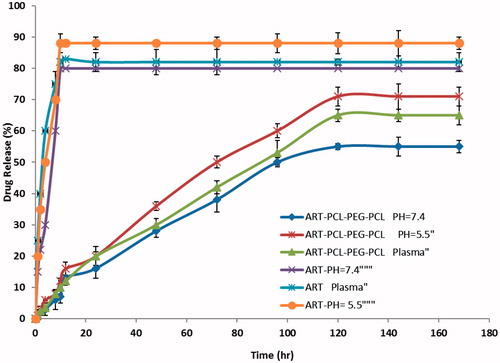
Figure 8. MTT Assay of ART, polymer, ART/micelles and control (PBS) on (a) 4T1 cell line after 48 h; (b) 4T1 after 72 h (c) MCF7 after 48 h and (d) MCF7 after 72 h.
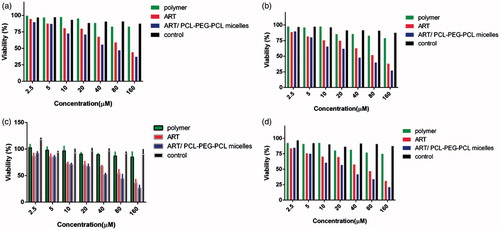
Figure 9. Effect of ART, polymer, ART/micelles and control (PBS) on the evolution of tumour volume in mice.
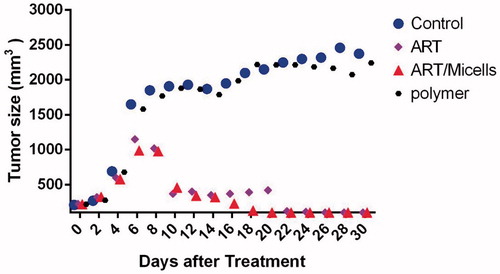
Figure 10. Body weight measurements of mice (seven per group) bearing 4T1 allografts which treated with fifteen intravenous injections, every other day, of ART 60 mg/kg, PCL–PEG–PCL, ART/PCL–PEG–PCL (60 mg ART/kg) and PBS (control).
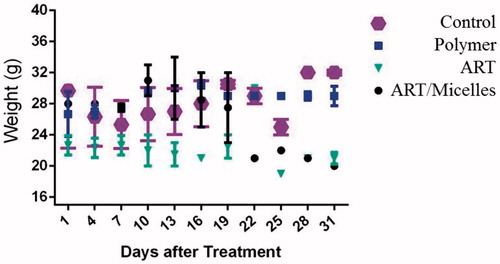
Figure 11. Comparison of in vivo plasma concentration versus time profiles of the different. ART formulations. All values reported are the mean ± SD (n = 7).
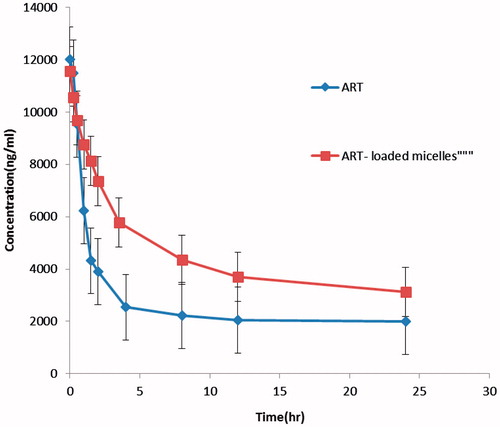
Table 3. Pharmacokinetic parameters of ART following single dose injection of ART aqueous solution and ART/micelles, in rats (n = 7).