Figures & data
Figure 1. The representative TEM images (left), size distribution histograms (right), and UV analysis of Nano-Se. (A–D) The morphology of as-synthesized Nano-Se exposure to different irradiation was characterized by TEM and their size distribution histograms were obtained by size analysis of over 150 particles. The mean diameters were 27.5, 25.8, 22.4 and 19.82 nm, respectively. Scale bar were 50 nm. (E) UV–vis spectroscopy of Nano-Se exposure to different irradiation.
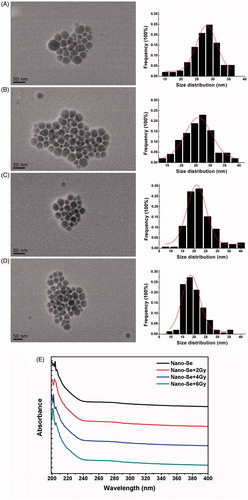
Figure 2. The biocompatibility and uptake of Nano-Se. (A) The viability of MCF-7 cells determined 24 h after treatment with Nano-Se at various concentrations. (B) Particles uptake by MCF-7 cells using flow cytometry.
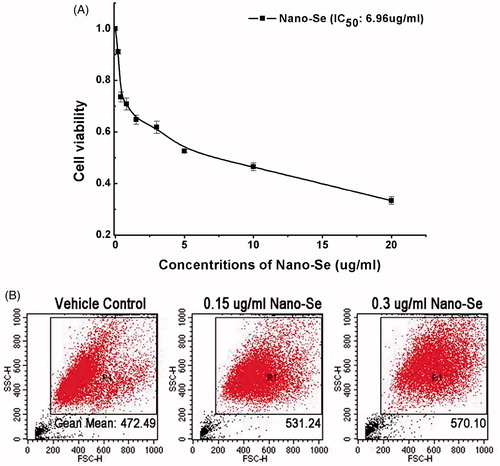
Figure 3. Enhancement of irradiation-induced growth inhibition by Nano-Se. (A) Cloning formations of irradiation with or without Nano-Se. (B) The surviving fraction of MCF-7 was decreased by irradiation in a dose-dependent manner, an effect that was potentiated by the addition of Nano-Se.
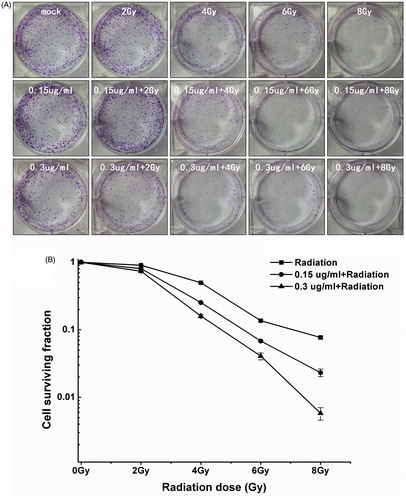
Figure 4. Enhancement of irradiation-induced mortality and apoptosis by Nano-Se. (A) MCF-7 cells were exposed to indicated concentrations of Nano-Se or 6 Gy or both, and stained with Annexin V/PI before flow cytometry analysis. Cell survival rates (B) and quantitative analysis of apoptosis cell percentage (C) obtained after flow cytometry evaluation (*p < .05, **p < .01, ***p < .001, the Nano-Se group (0/6 Gy) compared with vehicle control group (0/6 Gy); #p < .05, ##p < .01, ###p < .001, the combined group (Nano-se and radiation) compared with Nano-Se group).
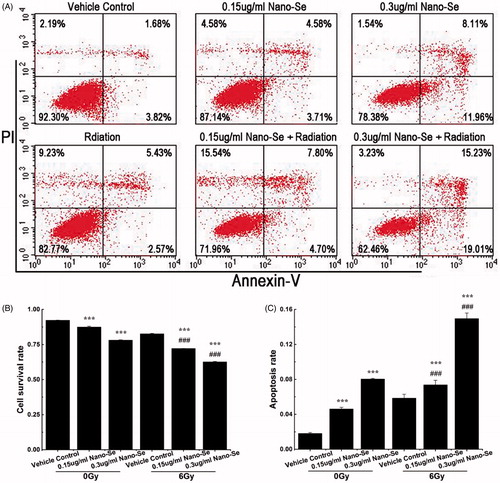
Figure 5. Effect of Nano-Se on MCF-7 cell cycle distribution. (A) Cells were pre-treated with the vehicle or Nano-Se for 24 h before exposure to 0 Gy or 6 Gy irradiation, and the fraction of cells in each phase of the cell cycle was analysed by flow cytometry. (B) Quantitative analysis of cell cycle distribution.
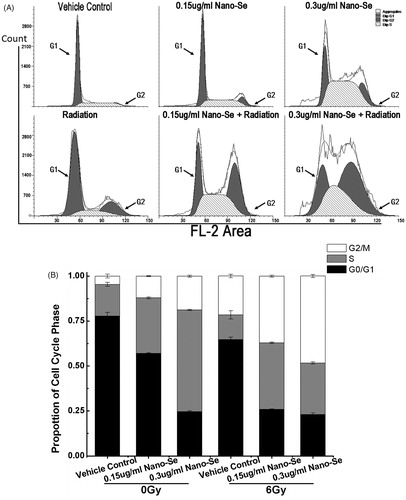
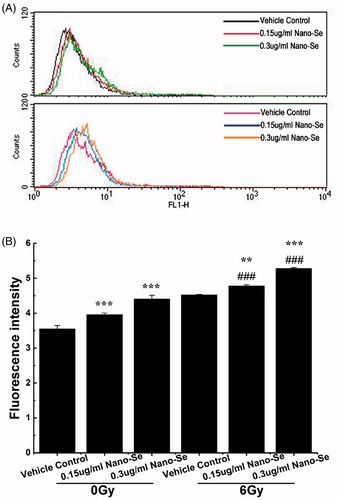
Figure 6. Detection of autophagy in MCF-7 cells by flow cytometry. (A) Cells were treated with indicated concentrations of Nano-Se without or with subsequent irradiation treatment. A 488 nm laser source and the FL1 channel were used to detect the green florescence of autophagic cells. (B) Quantitative analysis of autophagy (*p < .05, **p < .01, ***p<.001, the Nano-Se group (0/6 Gy) compared with vehicle control group (0/6 Gy); #p < .05, ##p < .01, ###p < .001, the combined group (Nano-se and radiation) compared with Nano-Se group).
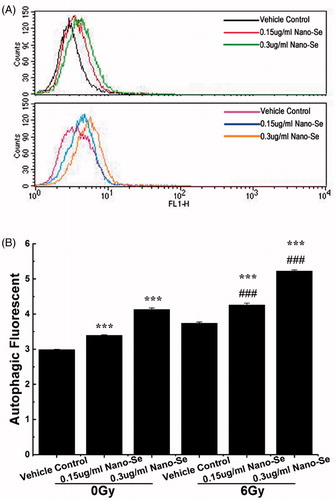
Figure 7. The effect of autophagy in the co-treatment. (A) Flow cytometry of MCF-7 cells treated with completed medium, irradiation (6 Gy), Nano-Se, combination of the nanoparticles and irradiation respectively with 3-MA (5 μM). Cell survival rates (B) and quantitative analysis of apoptosis cell percentage (C) obtained after flow cytometry evaluation (*p < .05, **p < .01, ***p < .001, the Nano-Se group (0/6 Gy) compared with vehicle control group (0/6 Gy); #p < .05, ##p < .01, ###p < .001, the combined group (Nano-se and radiation) compared with Nano-Se group).
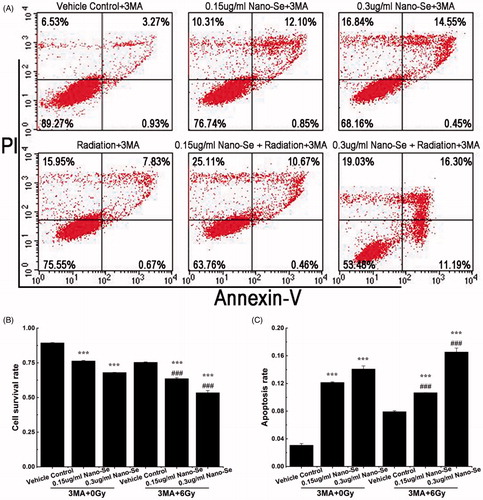
Figure 8. Detection of ROS in MCF-7 cells by flow cytometry. (A) Cells were treated with indicated concentrations of Nano-Se without (top) or with (bottom) subsequent irradiation treatment. A fluorometric assay based on the oxidation of DCFH-DA by intracellular oxidants was used in conjunction with flow cytometry to detect ROS. (B) Quantitative analysis of ROS (*p < .05, **p < .01, ***p < .001, the Nano-Se group (0/6 Gy) compared with vehicle control group (0/6 Gy); #p < .05, ##p < .01, ###p < .001, the combined group (Nano-se and radiation) compared with Nano-Se group).