Figures & data
Table 1. Formulation table of besifloxacin sol–gel system with observed gelling capacity.
Table 2. Physicochemical evaluation parameters of besifloxacin sol–gel system.
Table 3. Comparative antimicrobial assessment study of optimized besifloxacin sol–gel system (CG2) and besifloxacin suspension.
Table 4. Comparative pharmacokinetic parameter of optimized besifloxacin sol–gel system (CG2) and besifloxacin suspension.
Figure 1. Rheological study of different batch of BSF sol–gel system.
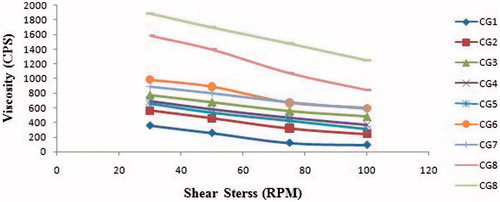
Figure 2. Ex vivo permeation profile of optimized BSF sol–gel system and BSF suspension across goat cornea.
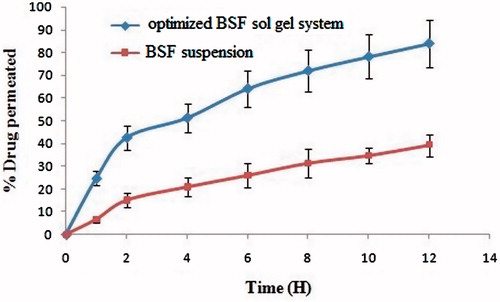
Figure 3. Histopathology of treated goat cornea (A) optimized BSF sol–gel system (B) BSF suspension.
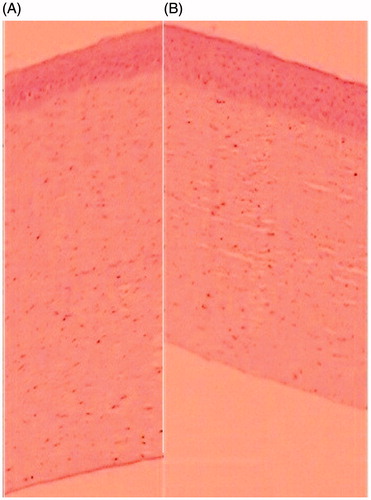
Figure 4. Het-Cam photograph for ocular irritation study treated with (A) 0.1 N NaOH, (B) Normal saline (C) Optimized BSF sol–gel system.
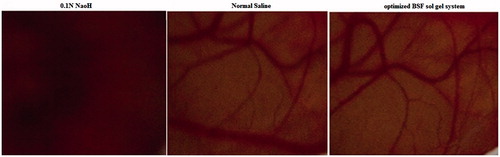
Figure 5. Comparative in vivo absorption study profile (A) optimized BSF sol–gel system (B) BSF suspension.
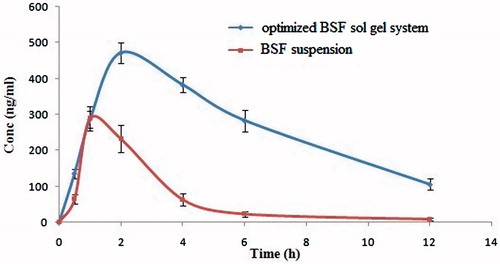
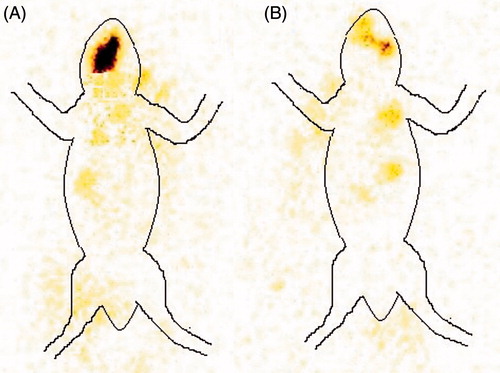
Figure 7. Radioactive-loaded gamma scintigraphy image (A) optimized BSF sol–gel system (B) BSF suspension.
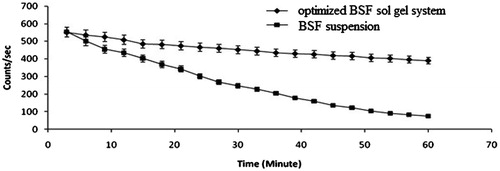
Figure 6. Gamma scintigraphy static whole-body images after 6 h of administration (A) optimized BSF sol–gel system (B) BSF suspension.