Figures & data
Figure 1. Visual observation of synthesis of AgNPs (A): (a) P. juliflora bark extract, (b) AgNO3 before addition of extract and (c) after addition of extract depicting synthesis of AgNPs as the colour turns to light brown in colour. (B) UV-vis spectra of biosynthesized AgNPs.
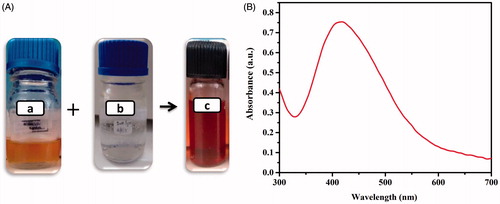
Figure 2. UV-vis spectra of biosynthesized PJB-AgNPs recorded as a function of (A) time, (B) concentration of AgNO3 solution, (C) concentration of extract, (D) temperature, (E) microwave and (F) after storage for 8 months.
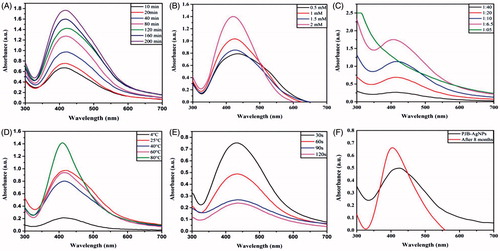
Figure 3. Physicochemical characterization of PJB-AgNPs. (A) Representative DLS spectrum of AgNPs, here hydrodynamic radius is ∼55 nm, (B) zeta potential of AgNPs is −16 mV, (C) SEM of AgNPs, the size of nanoparticles is ∼10–50 nm, and (D) EDS pattern of AgNPs showing prominent peak of silver.
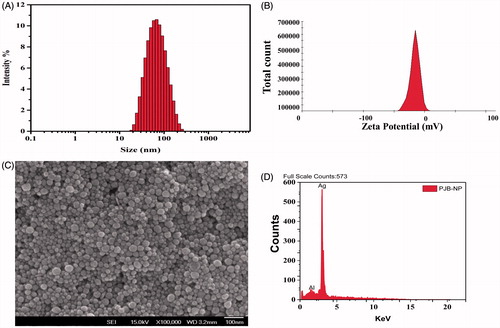
Figure 4. FTIR spectra of (A) P. juliflora bark extract and (B) biosynthesized PJB-AgNPs.
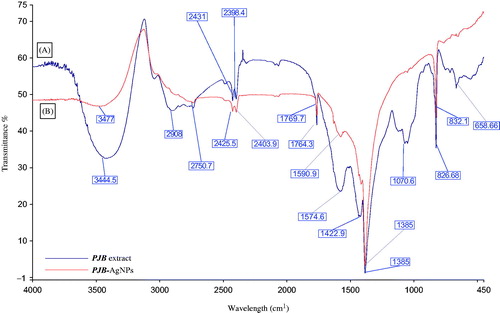
Figure 5. Antibacterial activity of PJB-AgNPs showing zone of inhibition of (A) E. coli and (B) P. aeruginosa. (C) Comparative graph for zone of inhibition of both. Here, kanamycin and autoclaved ddH2O were taken as positive and negative control, respectively.
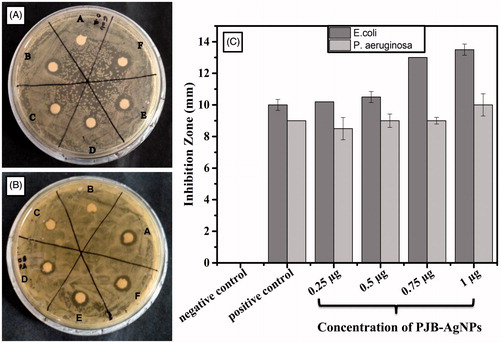
Figure 6. Anticancer activity against A549 cells treated with different concentrations of PJB-AgNPs, showing dose-dependent anticancer activity as determined by Alamar blue assay. (A) Untreated A549 cells as control and (B) A549 cells treated with PJB-AgNPs (C) Representative graph of anticancer activity.
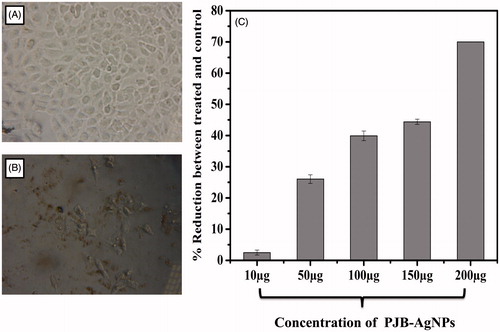
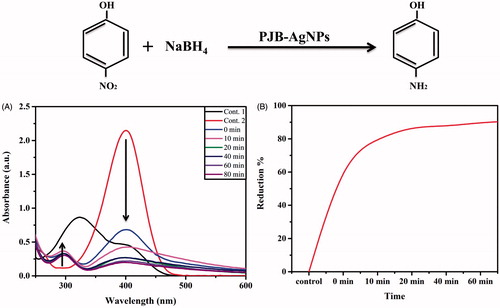
Figure 7. Photocatalytic degradation of 4-nitrophenol using biosynthesized PJB-AgNPs.