Figures & data
Figure 1. Dose–response curves for the antinociceptive effect of A. millefolium, (A), ORG (B), and A. millefolium–ORG encapsulated in liposome (C) in the second phase of formalin test.
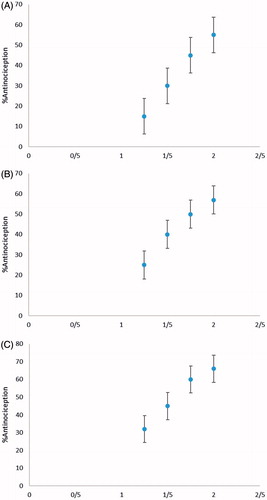
Figure 2. The isobologram antinociceptive synergistic interaction between A. millefolium and ORG extract encapsulated in liposome in the second phase of the formalin test.
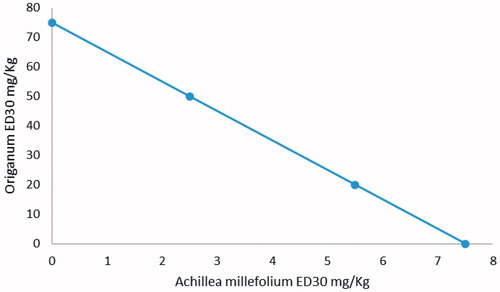
Table 1. Co-administration drug dose used.
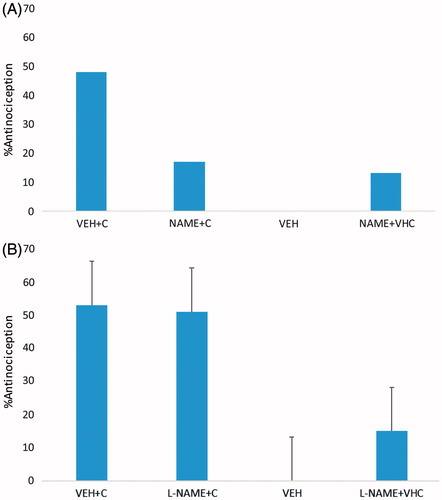
Figure 3. The effect of naloxone (A) and L-NAME (B) on the antinociceptive effect of the A. millefolium and ORG extract encapsulated in liposome combination. Bars are the mean ± SEM for at least six animals. Significantly different (*p < .05) from the co-administration (C), by one-way analysis of variance followed by the Student–Newman–Keuls test.