Figures & data
Table 1. Transfection conditions according to companies' instructions.
Figure 1. Methods used for analyzing flow cytometry data. Two control cells were prepared for data acquisition and analysis: untransfected cell control for optimizing SSC (side scatter) and FSC (forward scatter); and mock DNA control (the cells transfected by a vector without insert DNA) to subtract auto-fluorescence emitted by the transfection regents. After optimizing amplifiers, untransfected cell and mock DNA controls, and EGFP-transfected cells were read out by flow cytometry as density plot. Mock DNA density plots were analyzed based on gate regions of untransfected cell control plots to omit the auto-fluorescence of the cells, while the transfected cells were analyzed based on mock DNA gates in order to subtract fluorescence emitted by the transfection reagents. Gate regions R1 and R2 depict GFP negative and positive cells, respectively. Statistics of transfection rate and expression intensity (MFI) for each sample test were calculated and displayed as diagrams in .
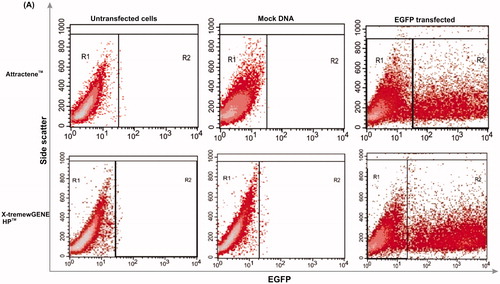
Figure 2. Transfection efficiency. Two key parameters of cell density and DNA/transfection reagent ratio were considered to evaluate transfection efficiency of AGS cells by means of transfection rate and MFI for Attractene™ (panels A and B) and X-tremeGENE HP™ (panels C and D) reagents, using BD FACSCalibur system. 48 h after transfection, the cells were trypsinized and then percentage of EGFP-expressing cells (transfection rate) and mean intensity of EGFP expression per cells (MFI) were analyzed with CellQuest Pro software (BD Biosciences, Franklin Lakes, NJ). Each value represents standard error of the mean (SEM) of triplicates. Asterisks (*) indicate statistical significance; *p < .05, **p < .01, ***p < .001 and ****p < .0001.
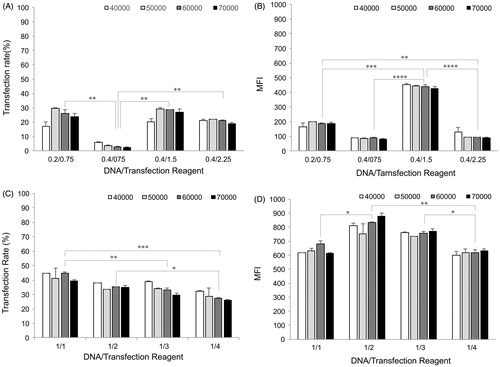
Figure 3. Fluorescence microscopic imaging of EGFP-transfected AGS cells. Transfection efficiency of the optimal transfection conditions for Attractene™ and X-tremeGENE HP™ reagents was studied under fluorescence microscopy. Phase contrast (top panel) and fluorescence (bottom panel) micrographs at 20× magnification.
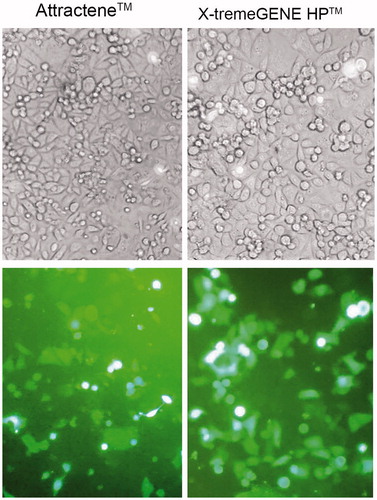
Figure 4. Cell toxicity assay. Influence of the Attractene™ (A) and X-tremeGENE HP™ (B) transfection reagents on the cell membrane integrity was studied by LDH release into culture media. The cells were incubated with different ratios of DNA/transfection reagent for 24 h, and then, culture supernatants were applied for the assay using LDH leakage assay kit (Roche, Basel, Switzerland). Each value represents the SEM of triplicates.
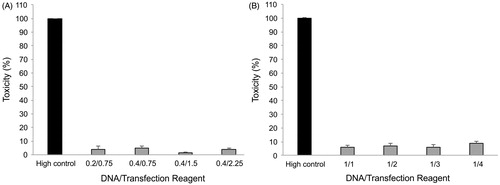
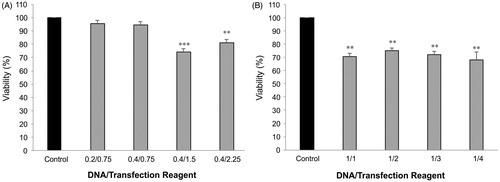
Figure 5. MTT viability assay. Effects of Attractene™ (A) and X-tremeGENE HP™ (B) on metabolic activity of AGS cells was determined by MTT viability assay using Cell Proliferation Kit (Roche, Basel, Switzerland). The cells were incubated with different ratios of DNA/transfection reagent for 24 h and after removing culture media for LDH leakage assay the same culture plates were applied for MTT test according to manufacturer's instructions. Each value represents the SEM of triplicates. Asterisks (*) indicate statistical significance when comparing with viability of control cells; **p < .01 and ***p < .001.