Figures & data
Figure 1. (A) Isolated CD133 + cells at day 0 counted by Haemocytometer. (B). Comparison of total number of MNC and CD 133+ after isolation.
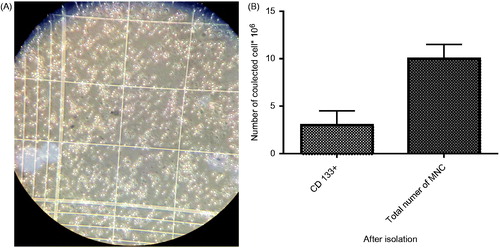
Figure 2. (A). Purity of isolated CD133 + cells before expansion. (B). Purity of CD133+cells after a7-day extension on Fn-coated PLLA. (C). On collagen-coated PLLA scaffold. (D). On PLLA scaffold. (E). On 2D culture system.
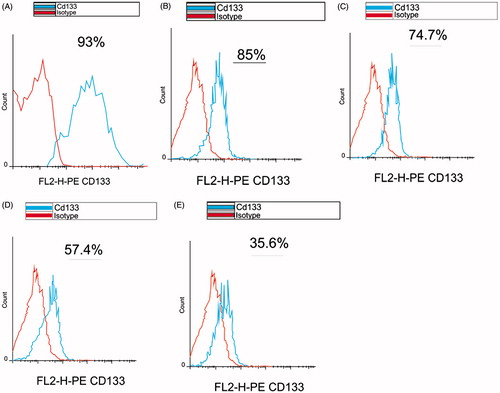
Figure 3. Effects of 2D culture system and PLLA scaffold coated with Fn and collagen(3D) on expansion of UCB CD 133+ stem cells on day 0, 3, 5, 7 (2D versus 3D).
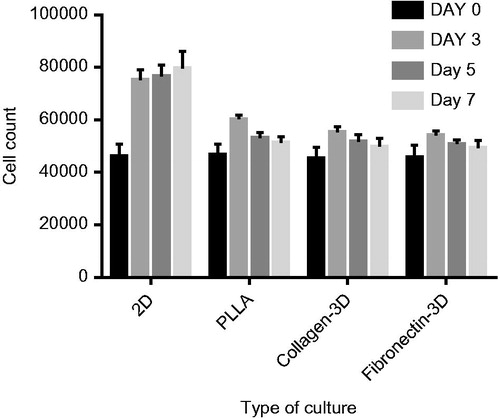
Figure 4. (A). SEM photographs of the PLLA scaffold before expansion. (B). SEM micrographs of CD133+adhesion on Fn-coated PLLA scaffold on day 7. (C). SEM micrographs of CD133+adhesion on collagen-coated PLLA scaffold on day 7. (D). SEM micrographs of CD133+adhesion on PLLA scaffold on day 7.
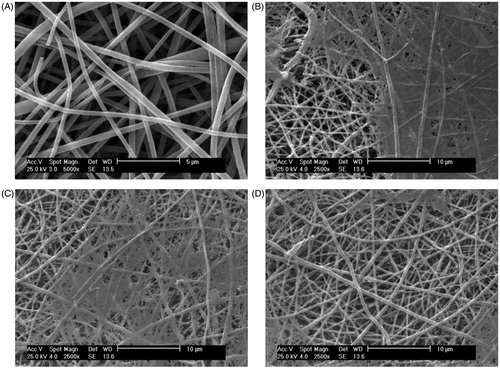
Figure 5. MTT assay results of CD133 + cells culture on three types of PLLA scaffold.
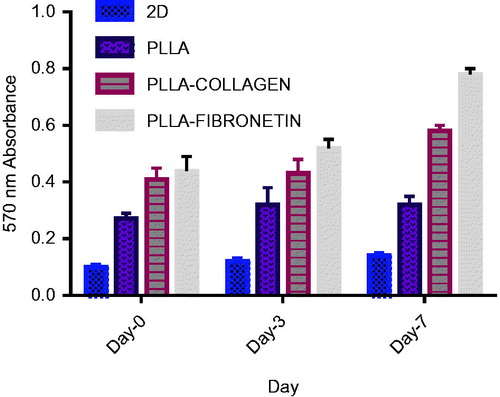
Figure 6. (A). Colony assays from experiments on Fn-coated PLLA. (B). On collagen-coated PLLA. (C). PLLA scaffold and.
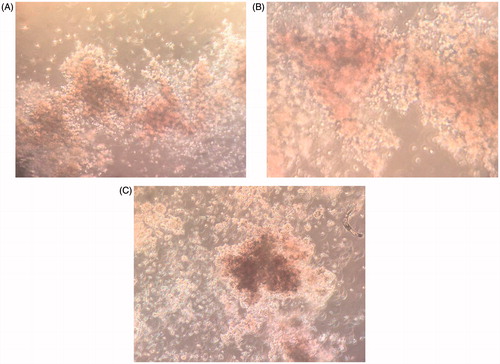
Figure 7. (A). CFU numbers (CFU-GM, CFU-GM, CFU-G, and CFU-GEMM) based on total CFU analysed for day-0 cells expanded in different culture system after 14 days. (B). CFU numbers (CFU-GM, CFU-GM, CFU-G, CFU-GEMM) based on total CFU analysed for day-7 cells expanded in different culture system after 14days. (C). Effects of culture system on 2D culture system and PLLA nanofibre scaffold (3D) (2D versus 3D) on CFU colony count.
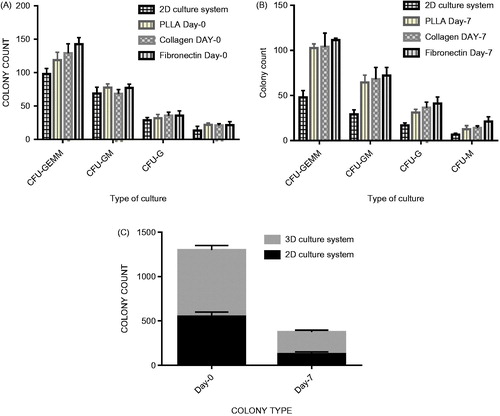
Table 1. CFU Colony count of CD133 + expanded cells on Fn-coated, collagen-coated, PLLA scaffold and 2D culture system.
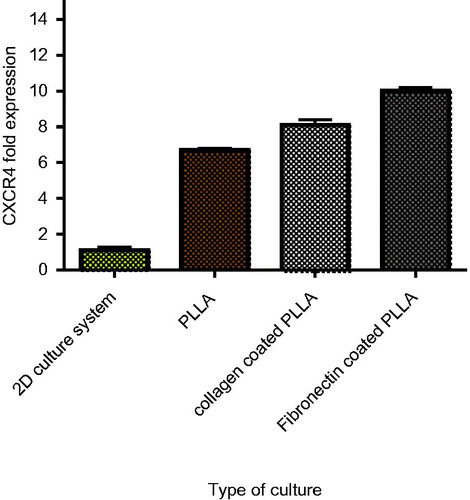
Figure 8. The relative expression of CXCR-4 after 7-day culture in collagen-coated PLLA and Fn-coated scaffold (3D) in comparison to 2D.