Figures & data
Figure 1. Schematic diagram for the immunosensor construction and the electrochemical immunosensing pathway of immunoreaction with human immunoglobulin G.
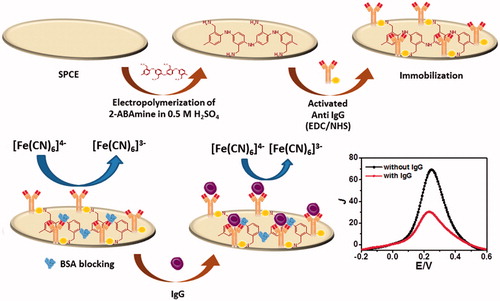
Figure 2. Cyclic voltammograms for electropolymerization of poly(2-aminobenzylamine) film on the screen-printed carbon electrode in solution containing 50 mM 2-aminobenzylamine and 0.50 M H2SO4.
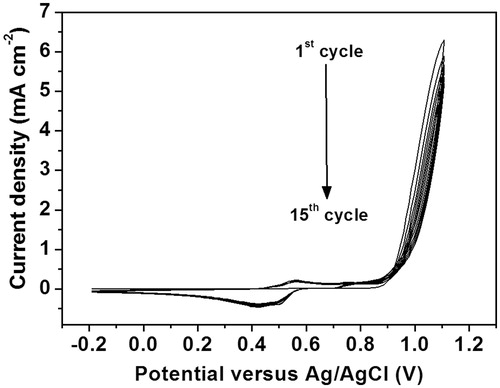
Figure 3. (a) Cyclic voltammograms and (b) differential pulse voltammograms for [Fe(CN)6]4-/3- process at poly(2-aminobenzylamine) film-modified screen-printed carbon electrodes with different numbers of electropolymerization cycles.
![Figure 3. (a) Cyclic voltammograms and (b) differential pulse voltammograms for [Fe(CN)6]4-/3- process at poly(2-aminobenzylamine) film-modified screen-printed carbon electrodes with different numbers of electropolymerization cycles.](/cms/asset/6e591374-b788-48a2-b8f8-73621f573896/ianb_a_1360322_f0003_c.jpg)
Figure 4. Scanning electron micrographs for (a) bare screen-printed carbon electrode and (b) poly(2-aminobenzylamine) film-modified screen-printed carbon electrode (15 polymerization cycles).
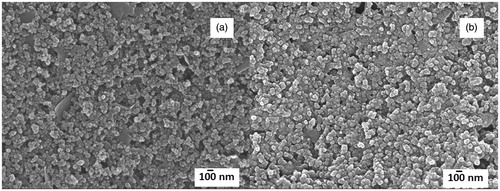
Figure 5. Differential pulse voltammetric current responses of screen-printed carbon electrode measured in a 5.0 mM [Fe(CN)6]4-/3- solution for each step of the modification. Anti-immunoglobulin G and immunoglobulin G concentrations used in this study are 60 μg mL−1 and 50 ng mL−1, respectively.
![Figure 5. Differential pulse voltammetric current responses of screen-printed carbon electrode measured in a 5.0 mM [Fe(CN)6]4-/3- solution for each step of the modification. Anti-immunoglobulin G and immunoglobulin G concentrations used in this study are 60 μg mL−1 and 50 ng mL−1, respectively.](/cms/asset/0a30937a-018a-4461-ad49-c933def13c37/ianb_a_1360322_f0005_b.jpg)
Figure 6. Effect of (a) concentration of activated anti-immunoglobulin G solution, (b) incubation time for the immobilization of antibody and (c) incubation temperature of antibody attachment on differential pulse voltammetric current responses of the ferro/ferricyanide system at the prepared anti-immunoglobulin G-conjugated screen-printed carbon electrode.
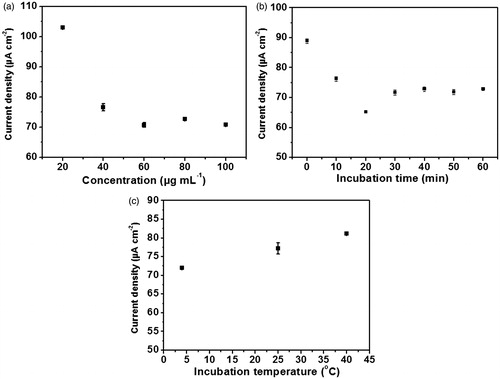
Figure 7. Effect of (a) incubation time, (b) temperature and (c) pH on differential pulse voltammetric current responses due to the immunoreaction.
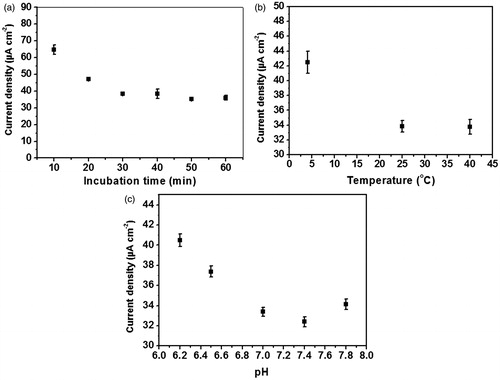
Figure 8. (a) Differential pulse voltammetric responses of the immunosensor for the detection of immunoglobulin G at different concentrations and (b) calibration curve of the immunosensor.
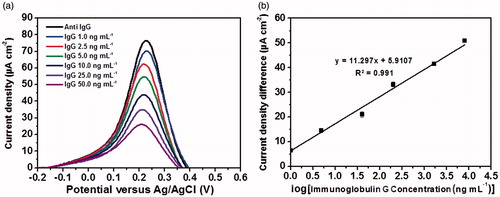
Table 1. Analytical performances comparison of proposed electrochemical immunosensor with other immunoglobulin G immunosensors reported in the literature.
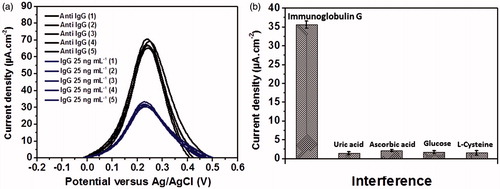
Figure 9. (a) Regenerability of the immunoelectrode and (b) analytical signals of 25 ng mL−1 immunoglobulin G, 0.10 mM uric acid, 0.10 mM ascorbic acid, 0.10 mM glucose and 0.10 mM L-cysteine measured by the developed immunosensor.