Figures & data
Figure 1. (A) Particle size distribution [green curve (the middle peak): H-NPs, blue curve (the shortest peak): C-NPs, red curve (the highest peak): H + C-NPs)] and (B) SEM photographs of all NPs.
![Figure 1. (A) Particle size distribution [green curve (the middle peak): H-NPs, blue curve (the shortest peak): C-NPs, red curve (the highest peak): H + C-NPs)] and (B) SEM photographs of all NPs.](/cms/asset/525c3858-d4bf-4f33-b168-2e1a5b708878/ianb_a_1360325_f0001_c.jpg)
Figure 2. The release profiles of P-NPs, H-NPs, C-NPs and H + C-NPs in vitro.
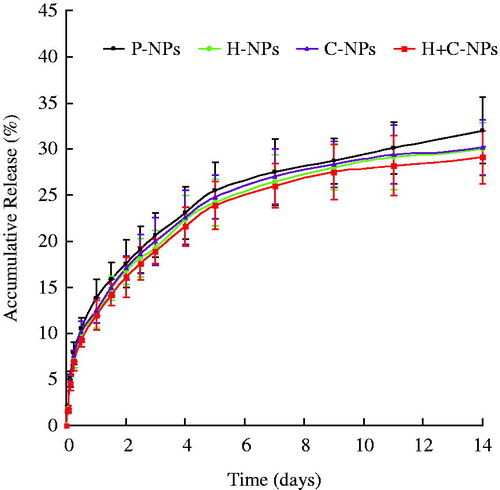
Figure 3. Cellular uptake of H + C-NPs. (A) The fluorescence microscopy photographs of HCC cells internalizing nanoparticles, in 400× magnification. (B) The SEM photographs of H + C-NPs on the surface of cells and (C) TEM photographs of H + C-NPs within cells.
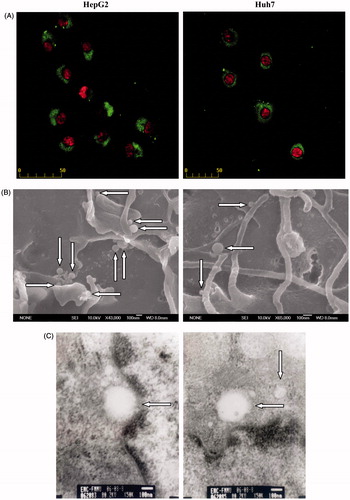
Figure 4. Intracellular fluorescence intensity of HCC cells internalizing P-NPs, BSA-NPs, H-NPs, C-NPs and H + C-NPs (*p < .05 vs. P-NPs and BSA-NPs; **p < .05 vs. H + C-NPs).
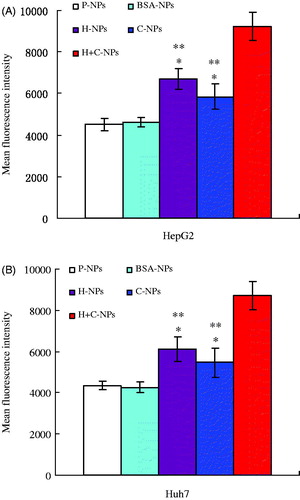
Figure 5. Phase-contrast photomicrographs of HepG2 and Huh7cells following a 24 h treatment with P-NPs, H-NPs, C-NPs and H + C-NPs, respectively.
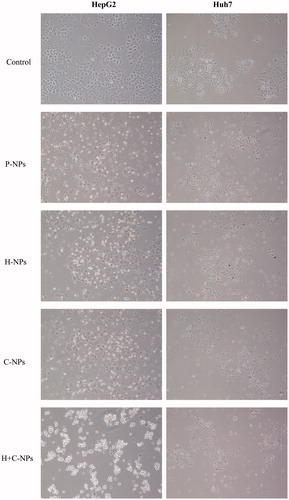
Figure 6. The effects of all NPs on the surviving fractions of HCC cell lines.
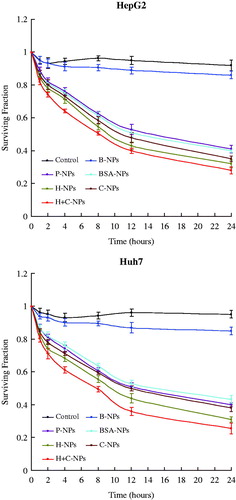
Figure 7. The distribution profiles of paclitaxel in different tissues of nude mice bearing HepG2 xenograft (*p < .05 vs. P-NPs and BSA-NPs; **p < .05 vs. H + C-NPs).
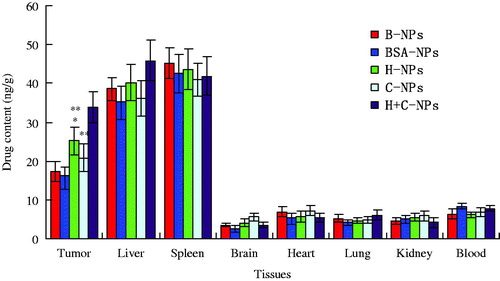
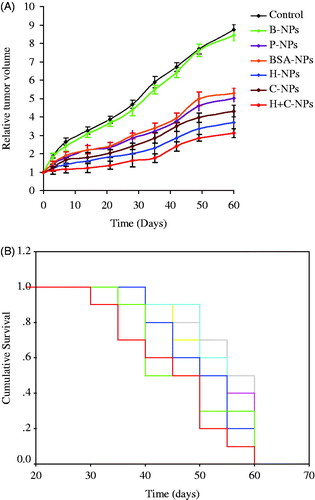
Figure 8. (A) In vivo anti-tumor activity assay (the curves of ![]()