
Figures & data
Figure 1. Characterization of MSNs. (a) TEM images of the MSNS1, MSNS2 and MSNRs. (b) Particle size of MSNS1 (∼90 nm), MSNS2 (∼190 nm) and MSNRs (∼200 nm). (c) Zeta potential of MSNS1, MSNS2 and MSNRs. Data are presented as the mean ± standard error of the mean (n = 3).
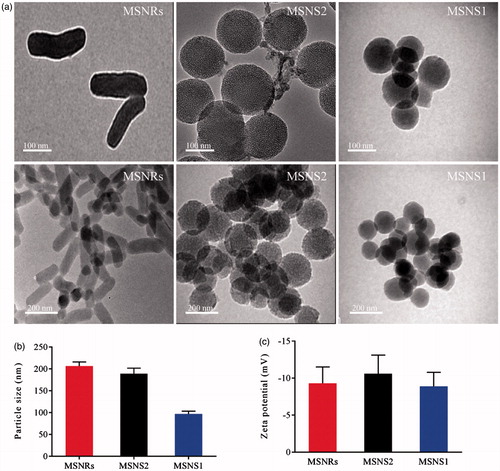
Figure 2. (a) Viability of Caco-2 cells after incubation with MSNRs or MSNSs for 24 h. (b) The MFI of FITC labelled MSNRs and MSNSs was measured by FACS in Caco-2 cells after treatment for 0.5, 1 and 2 h, respectively. (c) Confocal microscopy images of Caco-2 cells after treatment with FITC labelled MSNRs and MSNSs for 2 h. Scale bar represents 50 μm. (d) Cellular uptake mechanism of MSNRs and MSNSs. The data are presented as the mean ± standard error of the mean (n = 3). *p < .05 compared to control group; **p < .01 compared to control group.
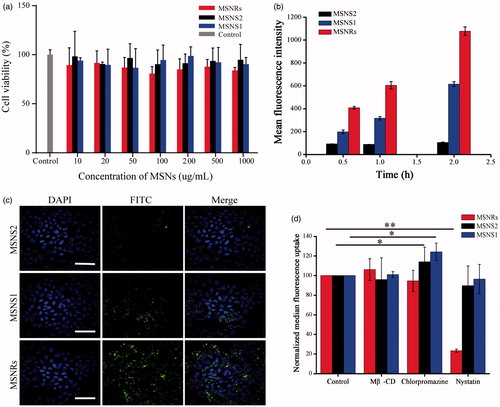
Figure 3. (a) LSCM images of Caco-2 cells after treatment with Dox formulations. Scale bar represents 20 μm. The white arrow indicated the drug delivered to nuclei. (b) Three-dimensional images of cellular internalization of Dox in Caco-2 cell monolayer. Scale bar represents 30 μm.
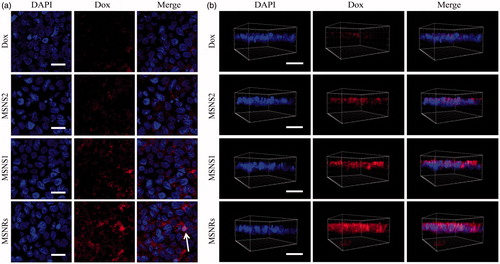
Table 1. Permeability value for MSNRs-Dox, MSNS1-Dox, MSNS2-Dox and Dox solution transported through Caco-2 cells.
Figure 4. LSCM images of Dox absorption at intestinal tissue with DAPI used to stain cell nucleus.
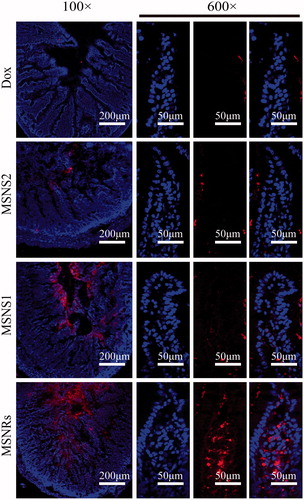
Figure 5. Plasma concentration vs time profile of different Dox formulations after oral administration (n = 3).
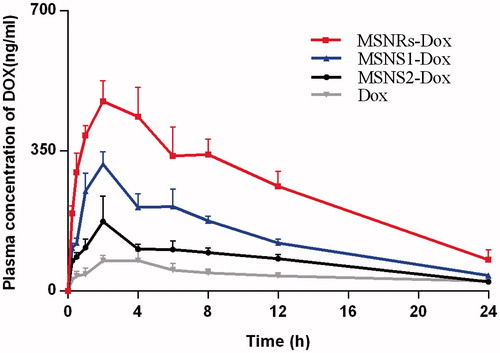
Table 2. Pharmacokinetic parameters of Dox after oral administration of different Dox formulations at a dose of 10 mg/kg to rats (n = 3).