Figures & data
Figure 1. Kinetic analysis of MSC osteoblast differentiation with HEMOXCell®. Osteoblast differentiation was analyzed at 5, 10, 15 and 20 days of culture in OBSCtl and OBSMOX media. DMEMCtl and DMEMMOX were used as undifferentiated references. Images represented (A) ALP activity staining of osteoblasts and (B) Alizarin red staining of mineralized matrix. Representative results of 3 independent experiments are shown.
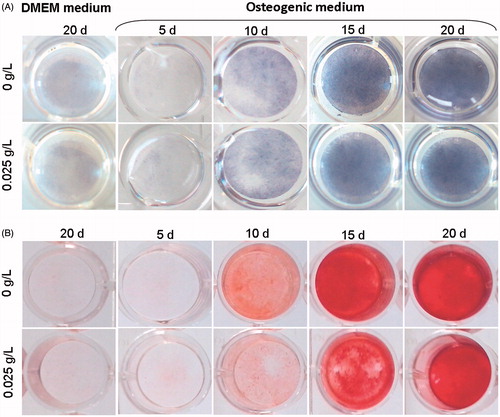
Figure 2. Analysis of cell viability and proliferation. (A) Construct morphology was observed using scanning electron microscopy. SEM microphotographs of BIOBank® powder cultured 24 h with MSCs. Scale bars represent 500 µm (1), 20 µm (2) and 50 µm (3). MSCs adhere to the scaffold and exhibit a fibroblast-like morphology. (B,C) Morphology and viability were analyzed after 2, 10 and 23 days. (B) Representative SEM images of MSCs cultured on bone powder at different magnifications, from top to bottom: ×100, ×400, ×800. (C) Confocal microscopy analysis of MSCs viability using Live/Dead® staining showed cell proliferation and viability on the powder. Data are representative of 3 different experiments.
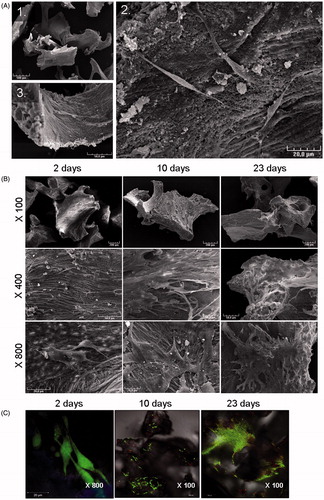
Figure 3. Cell proliferation and scaffolds seeding efficiency analysis. (A) CCK-8 proliferation assay of cell-constructs was performed under different conditions after 7 and 14 days under static culture. Data represent mean ± SD (n = 4, **p < .01; ***p < .0001; ns: non-significant). (B) MSCs were seeded into bone cylinders and cultured under static and perfusion in DMEM and osteogenic media (with and without MOX). After 24 h, seeding efficiency was calculated. For each condition, 10 different scaffolds were analyzed. Data are represented as mean ± SD (**p < .01).
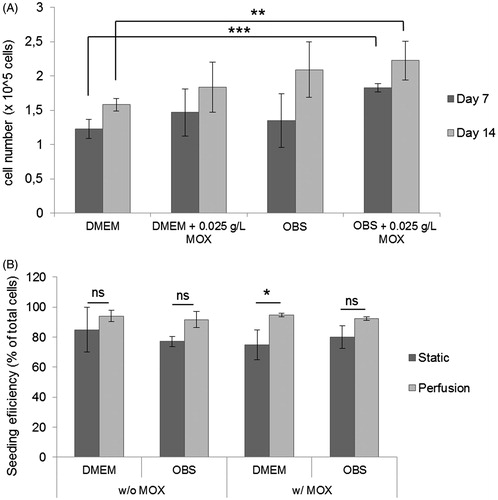
Figure 4. Histological analysis of cell distribution throughout BIOBank® scaffolds on resin embedding sections. Representative histological images of undecalcified scaffolds for cultures performed under static or perfusion systems after 4 weeks and stained with HES (A) and Movat’s Pentachrome (B) (Specimens diameter represents 8 mm). (HES stains: blue/black = nuclei; orange/pink = collagen; pink = cytoplasm) (Movat stains: red = fibrin; blue = mucin and extrafibrillar matrix; black = nuclei; yellow = collagen).
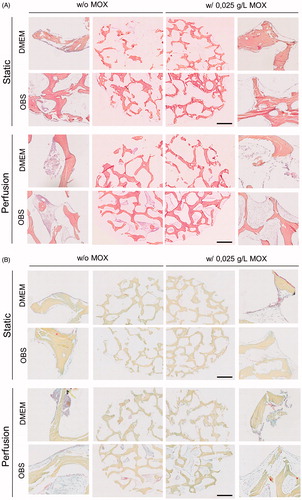
Figure 5. Immunohistological staining of Col I and scanning electron micrographs. (A) Representative images of Col I immunostaining for cells cultures under static and perfusion with and without 0.025 g/L HEMOXCell®. Data showed a high expression of Col I (brown stain) by MSCs especially under perfusion culture. Scale bars represent 100 µm. (B) SEM analysis of cell-scaffold constructs was performed after in vitro culture for 4 weeks. Images represent a magnification on a pore (scale bars represent 100 µm). Images are representative of two experiments.
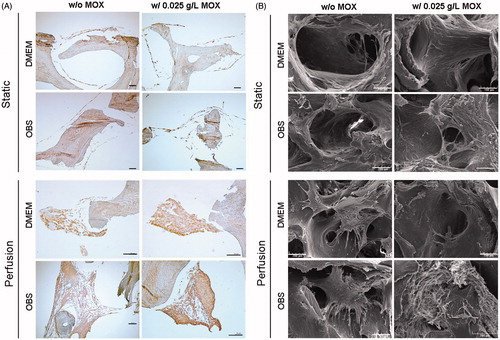
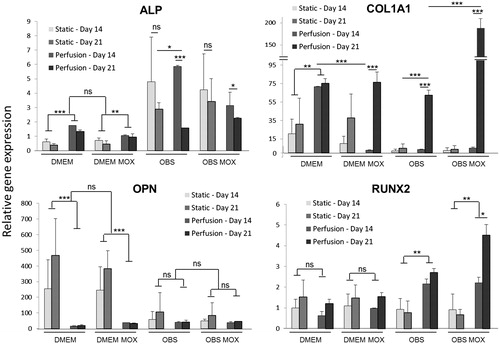
Figure 6. Evaluation of MSCs osteoblastic differentiation in bone cylinders. Osteogenic markers (ALP, COL1A1, OPN, RUNX2) expression levels were quantified at day 14 and 21 for MSCs grown in 3D-scaffolds with DMEM and OBS media (with and without MOX) under static and perfused conditions. qPCR data are represented as fold-change compared with the expression levels found in the uninduced MSCs cultured in 2-D. Values are mean ± SD (n = 3). Highly significant differences between 14 days and 21 days and between condition groups are represented with asterisks (*p < .05, **p < .001 and ***p < .0001).