Figures & data
Figure 1. (a) Ishikawa fishbone diagram illustrating CFV and DRV involved in fabrication of CS-Ca-SA microspheres and (b) steps involved in formulation CS-Ca-SA microspheres.
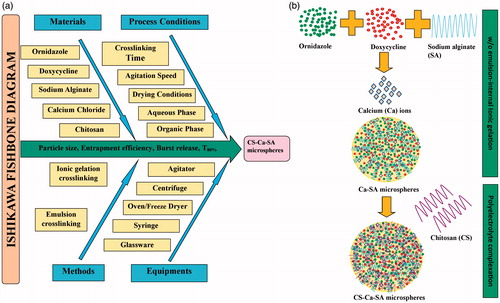
Table 1. Fabrication variables and dependent variables associated with microsphere formulation.
Table 2. Plackett-Burman factorial design for fabrication of CS-Ca-SA microspheres.
Figure 2. Demonstration of Pareto plots for the selection of CFV having significant effect on desired DRVs, viz. particle size (PS), average encapsulation efficiency (avEE), average burst release (avB) and average time for 80% cumulative drug release (avT80%).
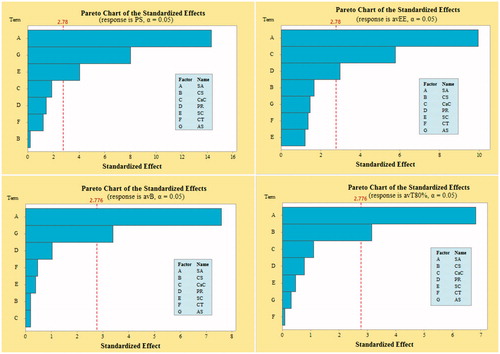
Figure 3. Contour and corresponding surface plots describing most influencing factors on particle size (PS), average encapsulation efficiency (avEE), average burst release (avB) and average time for 80% cumulative drug release (avT80%).
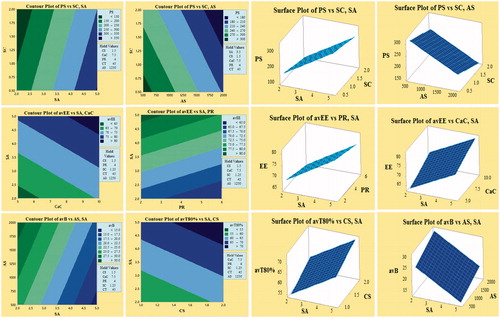
Table 3. Summary of ANOVA results and regression parameters.
Table 4. Comparison of predicted and experimental value for validation of model.
Figure 4. Overlay spectrum: (a) FTIR spectra of ornidazole, doxycycline, chitosan, alginate, physical mixture, placebo CS-Ca-SA and drug-loaded CS-Ca-SA microspheres; (b) DSC graphs of ornidazole, doxycycline, alginate, chitosan and CS-Ca-SA microspheres; and (c) XRD pattern of ornidazole, doxycycline, chitosan, alginate and CS-Ca-SA microspheres.
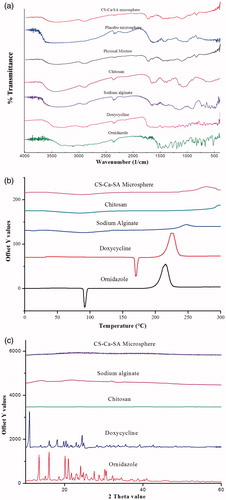
Figure 5. Microscopic view of microspheres. Optical microscopic images of (a) w/o microemulsion alginate drops dispersed in oil phase and (b) calculation of sphericity factor of microspheres. SEM images of (c) ornidazole powder, (d) doxcycline hyclate, (e, f, g) CS-Ca-SA microspheres and (h) surface view of microspheres.
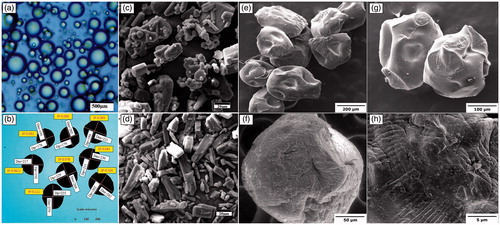
Figure 6. In-vitro dissolution profiles of ornidazole (OZ) and doxycycline hyclate (DX) from optimized CS-Ca-SA microspheres in phosphate buffer pH 6.8. Vertical bars indicate mean ± SD.
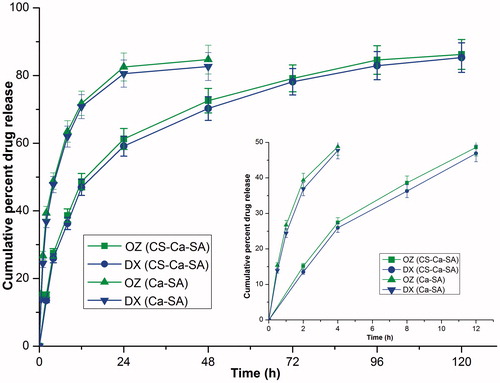
Table 5. Drug release kinetics of ornidazole (OZ) and doxycycline hyclate (DX) from CS-Ca-SA and Ca-SA microspheres.
Figure 7. Comparative (a) swelling curve and (b) erosion curve of optimized batches of Ca-SA and CS-Ca-SA microspheres in simulated saliva pH 6.8. Vertical bars show mean ± SD.
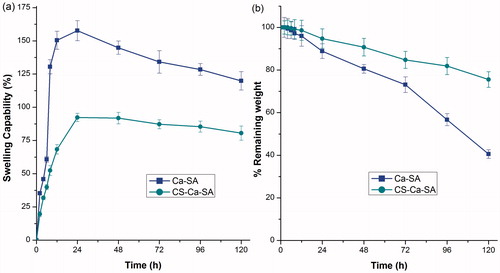
Figure 8. Zone of inhibition of dissolution study samples against S. aureus and E. coli. Vertical bars indicate mean ± standard error mean.
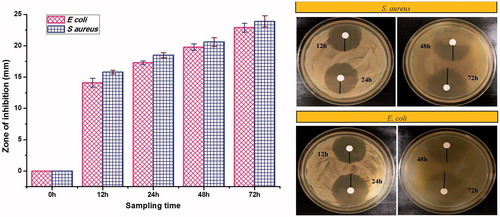
Figure 9. (a) Percentage cell viabilities of microsphere samples, A (0.01 g/ml), B (0.05 g/ml), C (0.1 g/ml) and control, prepared by incubating in DMEM media for 120 h against L929 cell lines. Vertical bars represent mean ± standard error mean (n = 6); (b) incubation time vs. IC50 plot; and (c) fluorescent microscopic images showing cytocompatibility of various microsphere samples (A, B, C and control (C1)) with L929 cell lines.
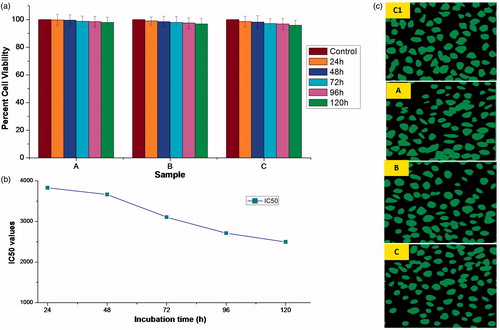
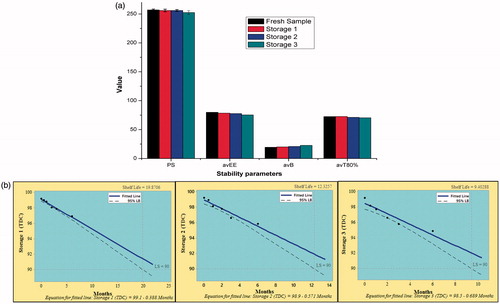
Figure 10. Stability study of optimized batch of microspheres at different storage conditions, viz. Storage 1 (refrigeration), Storage 2 (room temperature) and Storage 3 (high temperature). (a) Histograms representing stability parameters. Vertical bars indicate mean ± SD. (b) Shelf-life plots. LS: lower specification (90%).