Figures & data
Figure 1. Photograph showing colour changing: (A) Aqueous leaf extract of Albizia adianthifolia only (B) FeCl3·6H2O and FeCl2·4H2O without leaf extract of A. adianthifolia (C) Changing colour from reddish brown to black.
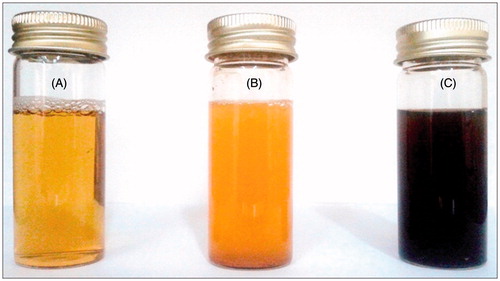
Figure 2. Photograph showing (A) separation of biosynthesized magnetic iron oxide nanoparticles from reaction mixture using an external magnet (B) MNPs without external magnet.
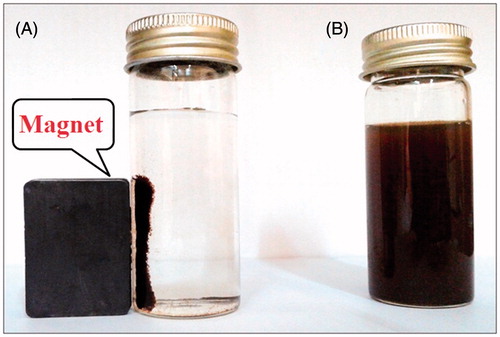
Figure 3. UV/Vis absorption spectra. (A) Phyto-redaction to iron oxide magnetic nanoparticles after reaction with aqueous leaf extract of Albizia adianthifolia. (B) Aqueous leaf extract of A. adianthifolia. (C) FeCl3·6H2O and FeCl2·4H2O only.
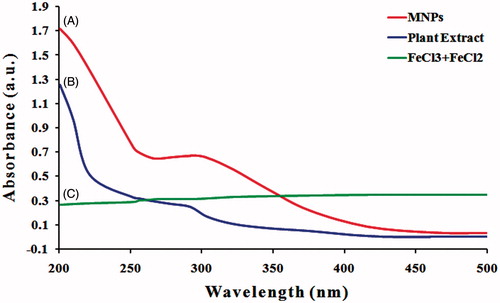
Figure 4. XRD spectrum patterns of iron oxide magnetic nanoparticles synthesized by leaf extract of Albizia adianthifolia. The structure of MNPs was matched with the Joint Committee on Powder Diffraction Standards (JCPDS, file No. 19-0629).
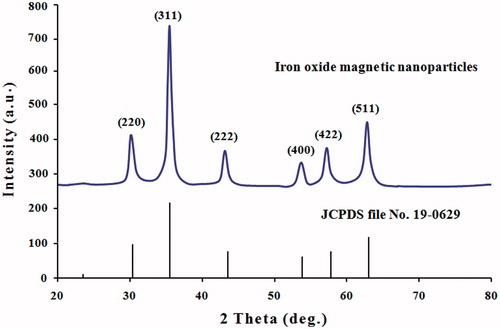
Figure 5. FTIR spectroscopy analysis. (A) Spectrum of leaf extract of Albizia adianthifolia and (B) spectrum of MNPs synthesized by leaf extract of A. adianthifolia.
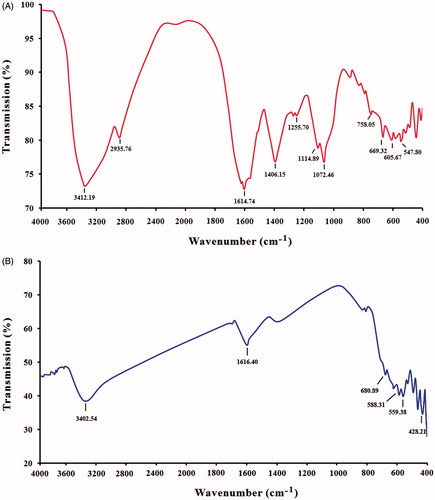
Figure 6. SEM image of MNPs showing uniformly distributed nanoparticles and some agglomeration. (A) Image with scale bar of 2 μM and (B) image with scale bar of 100 nm.
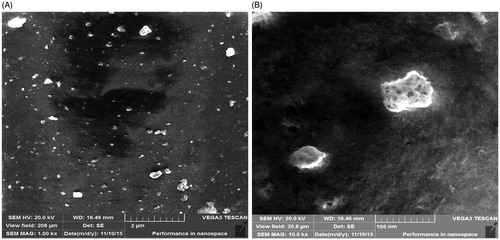
Figure 7. DPPH free radical scavenging activity. Antioxidant activity of MNPs at different concentrations of 50, 75, 100, 125, 150 and 200 μg mL−1. The values represent the mean ± SD of three experiments. Error bars are *p < .05, **p < .01, ***p < .001. Vit.C, vitamin C (positive control); P.E., plant extract (negative control) of Albizia adianthifolia at 200 μg mL−1.
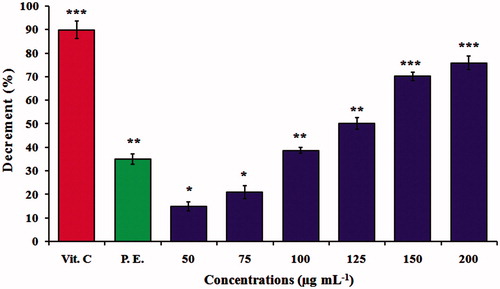
Figure 8. Magnetic capture of Staphylococcus aureus incubated at 37 °C for 1 h. (A) S. aureus without MNPs, (B) S. aureus with MNPs and (C) captured S. aureus using external magnetic field (0.5 T) in 1 min.
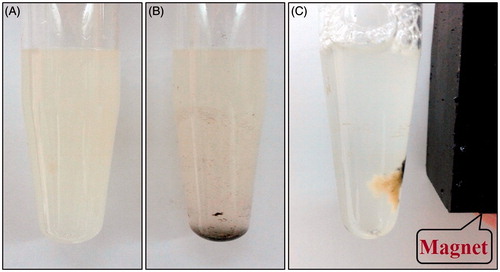
Figure 9. Growth inhibition of AMJ-13 and MCF-7 cell lines: (A) Cells treated with MNPs and (B) Cells treated with aqueous leaf extract of Albizia adianthifolia only. The values were the mean ± SD from three independent experiments expressed as percent with control. IC50 value of MNPs was 1.8 and 7.7 μg mL−1, respectively.
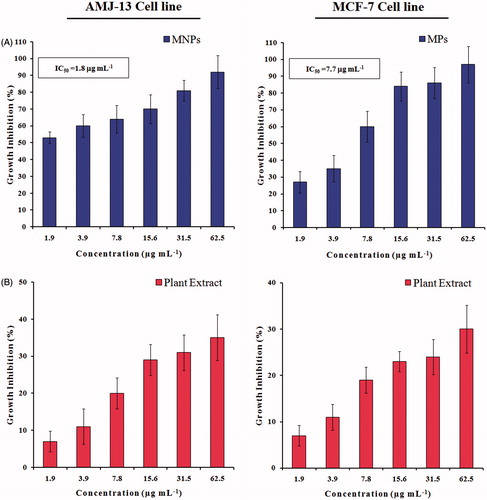
Figure 10. Microscopic images of AMJ-13 and MCF-7 cell lines: (Left lane) Non-treated cells, (Middle lane) Cells treated with aqueous leaf extract of Albizia adianthifolia only and (Right lane) Cells treated with MNPs. A: 1.9, B: 3.9, C: 7.8, D: 15.6, E: 31.5 and F: 62.5 μg mL−1 (200×).
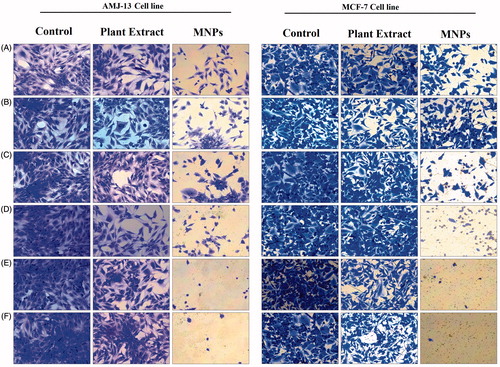
Figure 11. Microscopic images of in vitro targeting of cancer cells with MNPs. AMJ-13 cell line: (upper lane) and MCF-7 cell line: (lower lane). (A) Non-treated cells. (B) Cells incubated with MNPs at concentration of 62.5 μg mL−1 for 24 h.
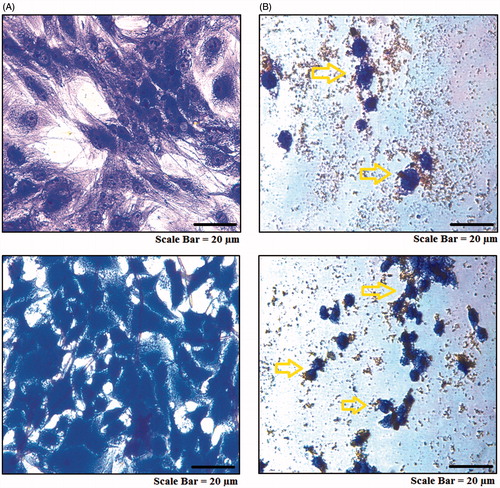
Figure 12. Colony formation assay of cancer cell lines. AMJ-13 cell line (upper lane) and MCF-7 cell line (lower lane). (A) Non-treated cells, (B) Cells treated with MNPs synthesized by leaf extract of Albizia adianthifolia.
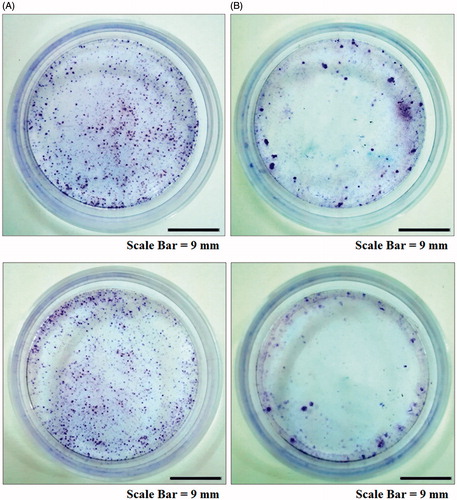
Figure 13. Mitochondrial membrane potential assay for cancer cells. AMJ-13 cell line (upper lane) and MCF-7 cell line (lower lane). (A) Non-treated cells. (B) Cells treated with MNPs staining.
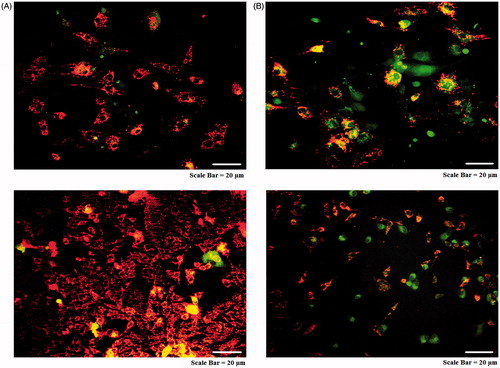
Figure 14. Morphological changes in acridine orange-propidium iodide dual staining of cancer cells. AMJ-13 cell line (upper lane) and MCF-7 cell line (lower lane). (A) Non-treated cells. (B) Cells treated with MNPs.
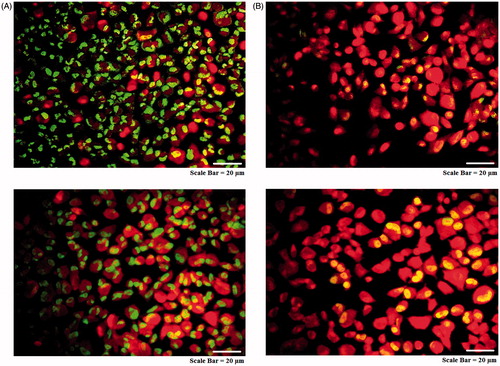
Figure 15. Comet assay for cancer cells. AMJ-13 cell line (A; upper lane) and MCF-7 cell line (B; lower lane). Class 0: normal nucleus, Class 1: halo around the nucleus, Class 2 and Class 3.
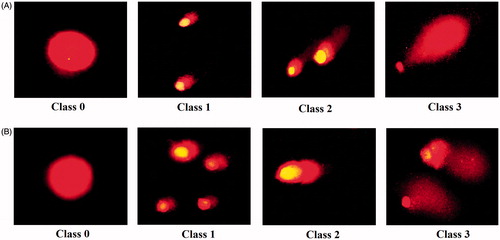
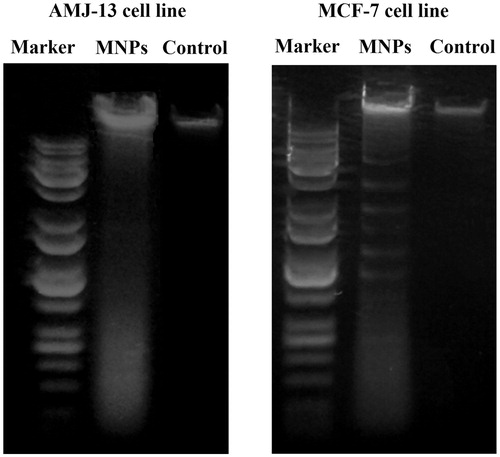
Figure 16. UV-illumination of fragmented DNA band images of cancer cells. AMJ-13 cell line (left lane), and MCF-7 cell line (right lane). Marker with molecular weight ranged from 100 to 10,000 bp was used.