Figures & data
Table 1. Primers of RT-PCR.
Figure 1. NTBR expression in glioma tissue and glioma cells. (A) RT-PCR was used to detect the expression of NTBR in paracancerous tissues and glioma tissues; (B) NTBR expression in glioma cell lines; (C) NTBR immunohistochemistry was used to detect the expression of NTBR in paracancerous tissues and glial tumours changes in the tumour.
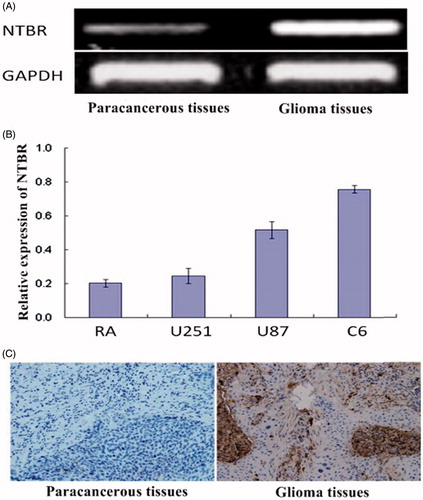
Figure 2. NTBR promotes the proliferation of malignant glioma cells. (A) IC50 to detect the concentration in the cell line; (B) MTT detection of cell proliferation after the addition of NTBR; and (C) cell cloning after the addition of NTBR single-cell proliferation expression.
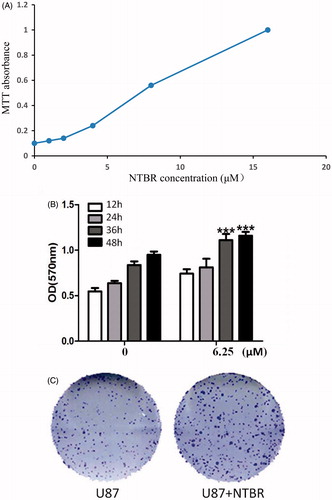
Figure 3. NTBR to promote malignant glioma cell immune escape. (A) Western blot to detect the expression of TGF-β in U87 after treated with endothelin B receptor; and (B) the expression of U87 after the addition of endothelin B receptor.
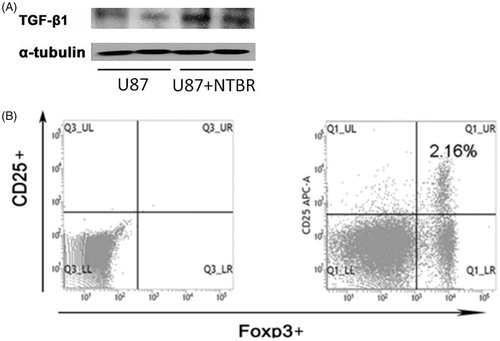
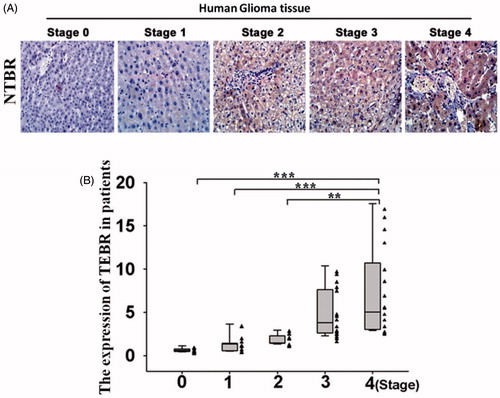
Figure 4. NTBR regulating tumour staging of glioma cells. (A) Immunohistochemistry was used to detect the expression of NTBR in different stages of malignant gliomas; and (B) clinical statistical analysis of NTBR expression in different stages of malignant gliomas.