Figures & data
Figure 1. Characterization of ZnONPs and AgNPs. (A) SEM image of ZnONPs. (B) Particle size distribution of ZnONPs (n = 50); (C) Ultraviolent-visible spectroscopy of ZnONPs. (D) SEM image of AgNPs. (E) Particle size distribution of AgNPs (n = 50). (F) Ultraviolent-visible spectroscopy of AgNPs.
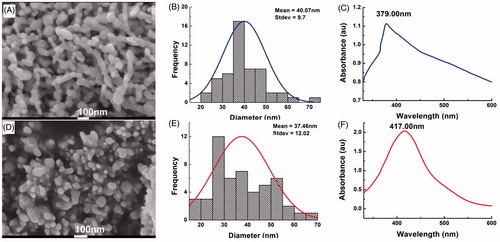
Figure 2. Optimization of nanofibre formulations on the voltage, flow rate and collected distance. The prepared nanofibres were observed by a microscope (200×).
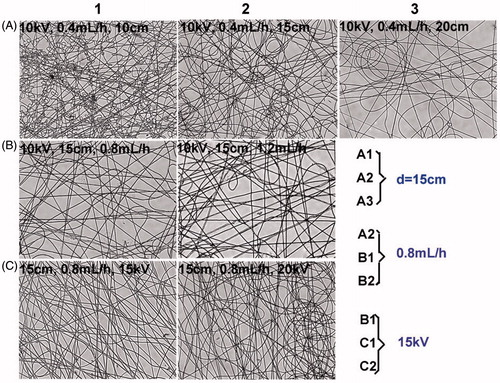
Figure 3. Influence of PVP/PCL proportion on nanofibre formulations. (A) Micrographs of PVP/PCL nanofibres at different mass ratios. (B) Influence of various proportion of PVP/PCL on the water vapour permeability. (C) Influence of various proportion of PVP/PCL on the swelling degree. (D) Influence of various proportion of PVP/PCL on the weight loss. *p < .05; **p < .01; ***p < .001, compared with the control group (n = 3).
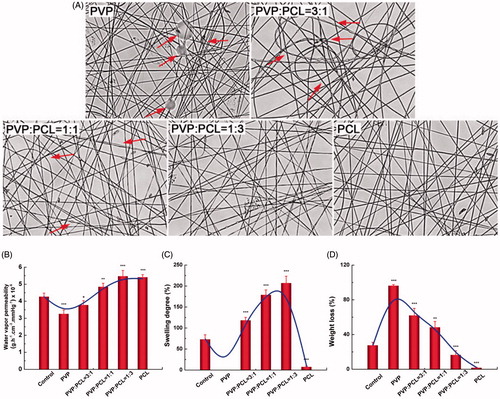
Figure 4. Morphology and in vitro characteristics of ZnO/Ag/PVP/PCL composite nanofibres. (A) Drug-loaded nanofibre formulations visualized by scanning electron microscope (SEM), Scale bar: 1 μm; arrows represent nanoparticle mass. (B) The fibre diameter distribution of drug-loaded nanofibres.
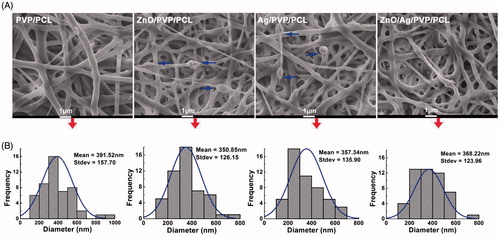
Figure 5. FT-IR analysis of the nanofibre formulations.
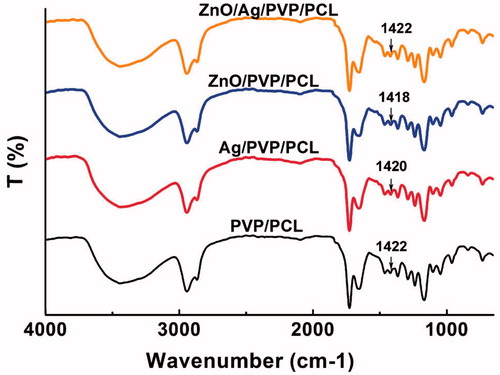
Figure 6. DSC analysis of the nanofibre formulations.
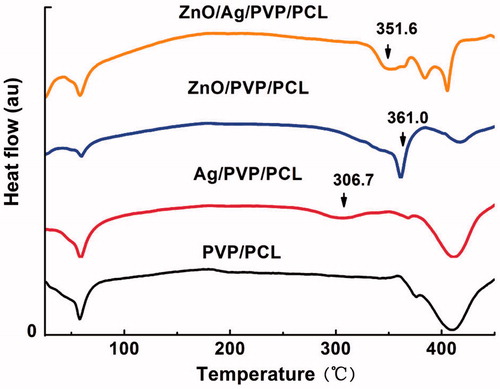
Figure 7. Physicochemical properties of the drug-loaded nanofibre formulations. (A) Water vapour permeability of drug-loaded nanofibres. (B) Swelling degree of drug-loaded nanofibres. (C) Weight loss of drug-loaded nanofibres. n.s., no significance (n = 3).
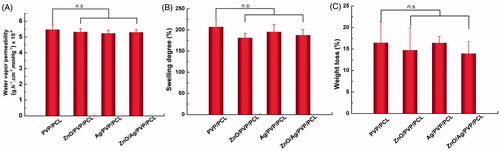
Figure 8. The antibacterial effect of the nanofibre formulations against Staphylococcus aureus and Escherichia coli. (A) Inhibition zone of the various contents of drug-loaded nanofibres. (B) Bactericidal kinetic study of Staphylococcus aureus and (C) Bactericidal kinetic study of Escherichia coli. *p< .05; #p<.05, compared with the Ag/PVP/PCL, ZnO/Ag/PVP/PCL (ZnO/Ag =1) and ZnO/PVP/PCL, respectively (n = 3).
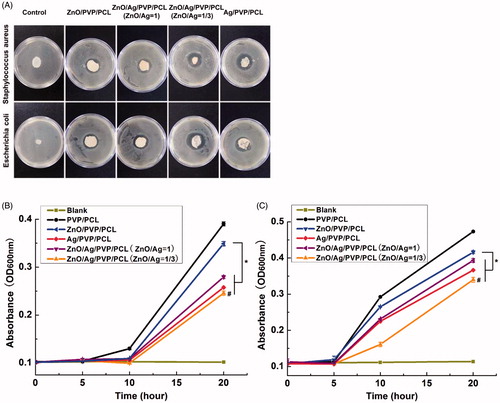
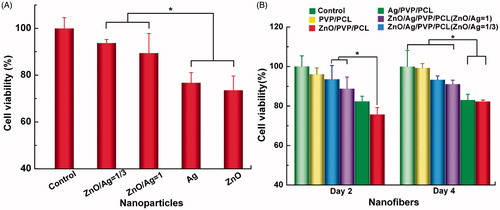
Figure 9. Cytotoxicity of ZnO and Ag against the human skin fibroblasts (HSFs). (A) Cell viability of ZnONPs and AgNPs towards HSFs. (B) Cell viability of the prepared nanofibres towards HSFs at day 2 and 4. *p<.05 (n = 3).