Figures & data
Table 1. Fatty acid composition (weight % of total fatty acids) of EO in the current study.
Figure 1. FE-SEM images of fabricated nanofibres, PCL/PEG (A), EO-PCL/PEG (B and C).
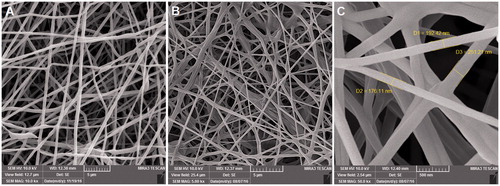
Figure 2. Stress–strain curve of PCL/PEG and EO-PCL/PEG nanofibers using Universal Testing Machine.[Citation19].
![Figure 2. Stress–strain curve of PCL/PEG and EO-PCL/PEG nanofibers using Universal Testing Machine.[Citation19].](/cms/asset/f60d4786-7c89-489c-9588-27f11844dcd4/ianb_a_1367689_f0002_c.jpg)
Figure 3. Cell viability of RAW264.7 macrophages grown on PCL/PEG nanofibres, EO-PCL/PEG nanofibres and tissue culture plates (TCPs) after 1and 3 d of cell culture (*p < .05). Values are expressed as mean ± SD of three parallel measurements.
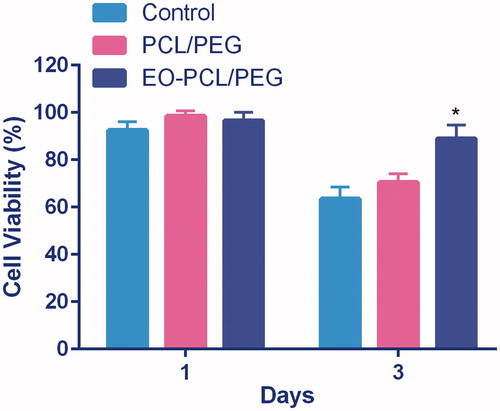
Figure 4. The influence of EO blended in PCL/PEG nanofibres on cell morphology of M1 macrophages. FE-SEM images of M1 macrophages cultured on PCL/PEG and EO-PCL/PEG nanofibres for 3 d.
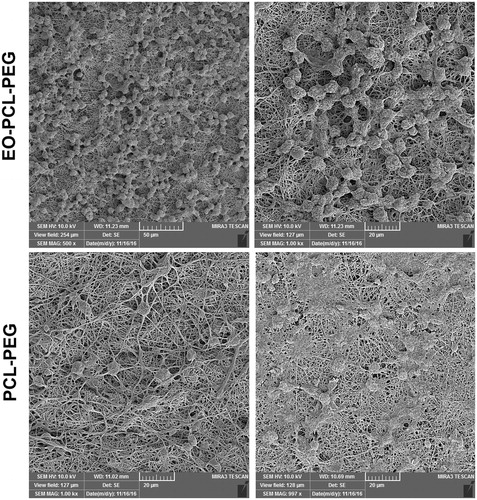
Figure 5. In vitro polarization study. Expression levels of iNOS-2 (M1 marker) and Arg-1 (M2 marker) in M1 RAW264.7 macrophages seeded on PCL/PEG and EO-PCL/PEG nanofibres for 72 h (*p < .05), Results are mean ± SD (n = 3).
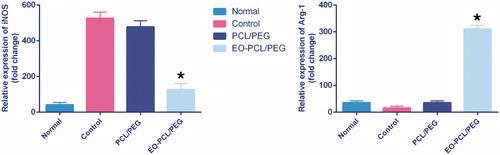
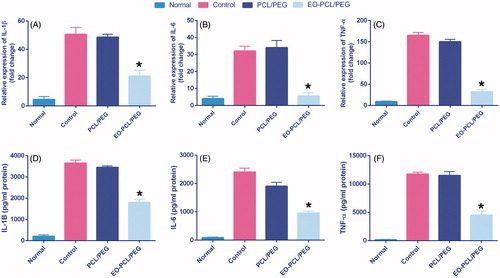
Figure 6. Anti-inflammatory effect of PCL/PEG and EO-loaded PCL/PEG nanofibres evaluated on RAW264.7 cells stimulated with LPS/INF-γ. Histograms show the mean values of mRNA levels of (A) IL-1β, (B) IL-6, and (C) TNF-α and the amounts of (D) IL-1β, (E) IL-6, (F) TNF-α after ELISA evaluation (*p ≤ .05 versus PCL/PEG and control groups). Results are mean ± SD (n = 3).