Figures & data
Figure 1. Optical images of the mixture of aqueous 1 mM AgNO3 solution and seed-derived callus extract of Catharanthus roseus, showing varying colours as a function of time (a), and UV–Vis spectra of the reaction mixture at various reaction times (b).
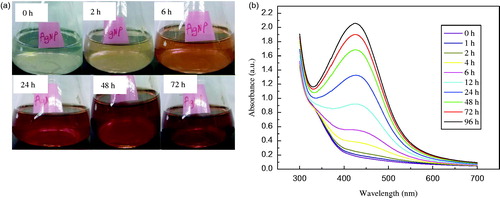
Figure 2. Transmission electron micrograph of Ag NPs synthesized from the callus extract of C. roseus after 24 h of reaction with aqueous 1 mM AgNO3 solution (a), and particle size distribution obtained using Image J software from approximately 100 Ag NPs in the micrograph (b).
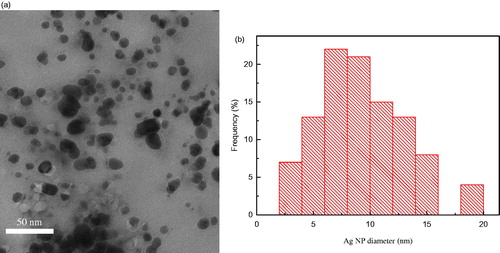
Figure 3. X-ray diffraction pattern of the lyophilized Ag NPs synthesized from seed-derived callus extract of C. roseus.
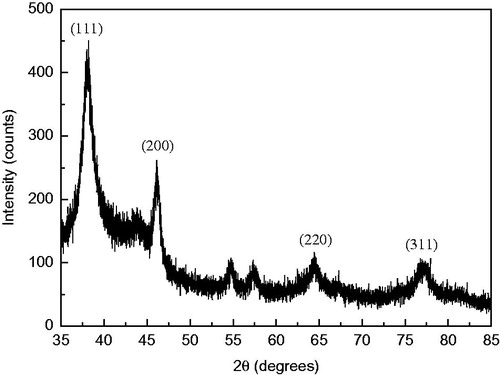
Figure 4. Fourier transform infrared spectroscopy spectra of (a) lyophilized powders of Ag NPs synthesized from seed-derived callus extract of C. roseus and 1 mM AgNO3 solution, and (b) seed-derived callus extract of C. roseus.
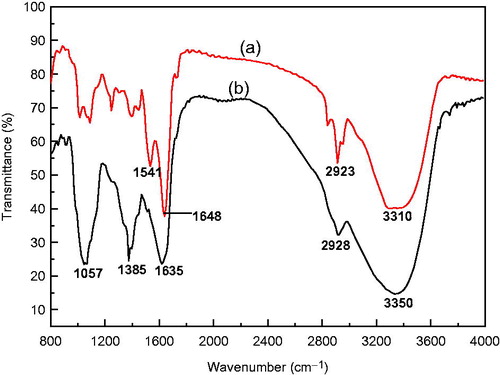
Figure 5. Diameter of the zone in which bacterial growth was inhibited by various amounts of the Ag NPs synthesized with seed-derived callus extract of C. roseus after 1 and 8 weeks of storage under ambient conditions (mean ± SD, n = 3).
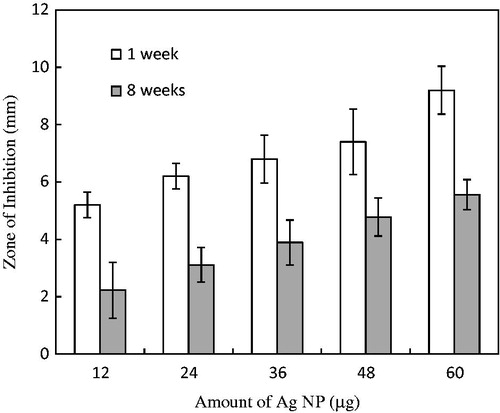
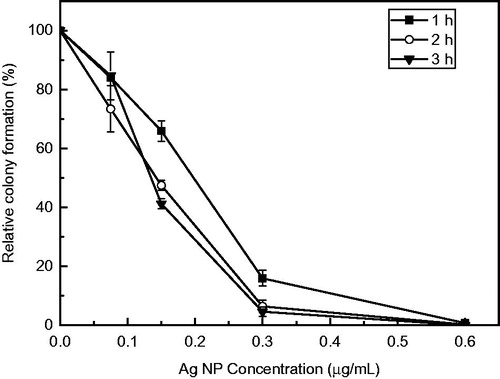
Figure 6. Inhibition of colony formation of E. coli exposed to various concentrations of the synthesized Ag NPs after 1 week of storage under ambient conditions (mean ± SD, n = 3). Relative colony formation is expressed as a percentage of the average number of colonies from nanoparticle-treated microbial suspension compared with the number on the water control.