
Figures & data
Figure 1. Photographs showing in situ gels before (room temperature) and after (33 °C) gelation.
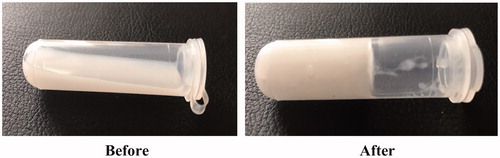
Figure 2. Mean viscosity–temperature profiles of KCL PN-HA in situ gels. KCL (0.5%, w/v), PN-HA (1%, w/v), chlorhexidine acetate (0.01%, w/v), and glycerol (2%, w/v), (n = 3).
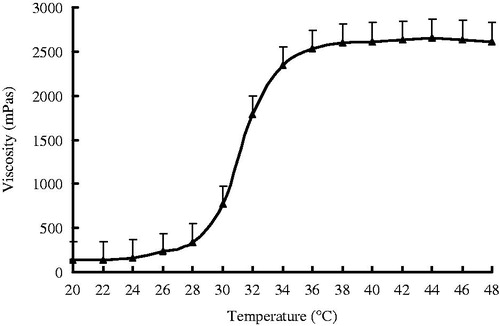
Table 1. The stability studies of the KCL in situ gel during the 3 months.
Figure 3. In vitro release profiles of KCL in situ gels from three batches. Release experiments were carried out in distilled water as a dissolution medium at 33 ± 0.5 °C. Each point represents the mean value of three different mean ± SD. △: free drug; ▲: KCL in situ gels.
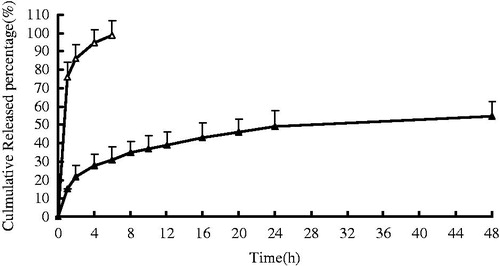
Table 2. Correlation coefficients for kinetic analysis of release data for KCL in situ gels.
Table 3. Score obtained from eye irritation assessment of KCL PN-HA in situ gels and commercial KCL eye drops in New Zealand white rabbits.
Figure 4. Pathological observation of the corneal tissues in the established rabbits’ models. (×5000). A: normal; B: KCL PN-HA in situ gels; C: commercial KCL eye drops; D: negtive control.
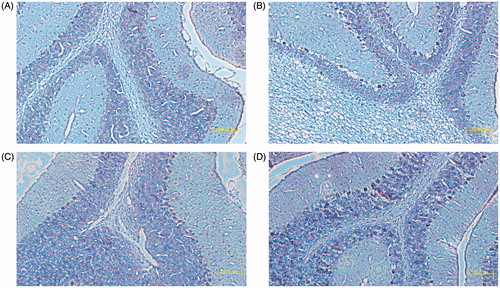
Table 4. Effect of different KCL antifungal formulations on rabbits’ corneas (n = 12).