
Figures & data
Figure 1. Diagram depicting the three-dimensional structure of histone deacytlase-1 enzyme in new cartoon view.
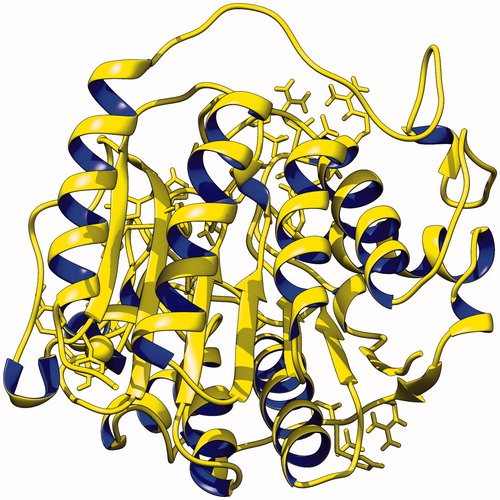
Figure 2. (A) The Ramachandran plot of HDAC-1 enzyme. Plot shows structure lies within the favoured and allowed region; (B) ProSA-web interface analysis depiction of HDAC-1 protein structure with NMR/X-ray plot of known structures.
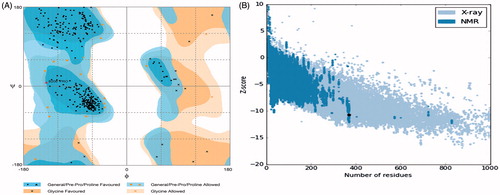
Figure 3. Depiction of molecular docking complexes. (A) Interacting complex of HDAC-1 enzyme with the first lead compound 7. New cartoon ribbon view of the HDAC-1 enzyme with interacting compound-7, at its interior. Also shown the enlarged view of compound-7 at right and (B) interacting complex of the HDAC-1 enzyme with compound 9. New cartoon ribbon view of the HDAC-1 enzyme with interacting compound-9, at its interior binding groove. Also shown the enlarged view of compound-9 at right.
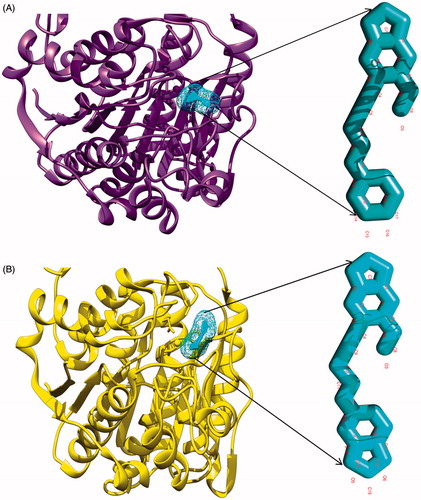
Figure 4. (A) Surface view of interaction of compound 7 to the binding groove of HDAC-1 enzyme and (B) surface view of interaction of compound 9 into the binding groove of HDAC-1enzyme.
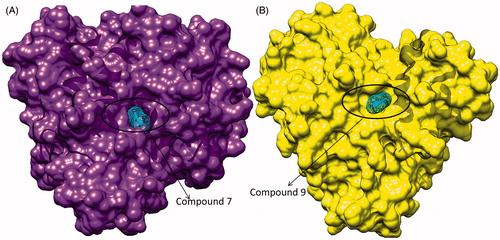
Table 1. Molecular binding free energy scores of designed compounds with the receptor HDAC-1 enzyme, using the AutoDock Vina and HEX 8.0 molecular docking software.
Figure 5. (A) Depiction of hydrophobic interactions between the compound 7 and HDAC-1 enzyme, derived through molecular docking and (B) depiction of hydrophobic interactions between the compound 9 and HDAC-1 enzyme, using PDBsum web interface.
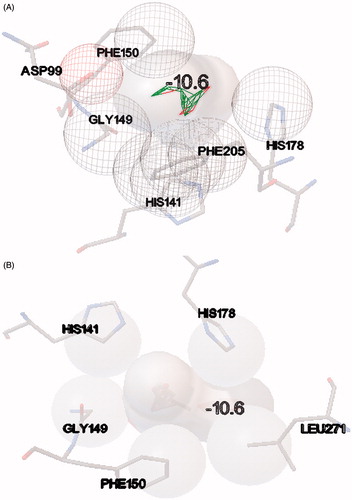
Table 2. Pharmacological properties of standard compounds and lead compounds.
Figure 6. Graphs between the numbers of atoms versus the volume of compounds. (A) Compound 7 was found to be under the P-gp non-substrate region (out of box region in graph), whereas P-gp substrates compounds comes under the box region and (B) compound 9 was also found to be under P-gp non-substrate region (out of the box region in graph), whereas P-gp substrates comes under the region inside the box in graph.
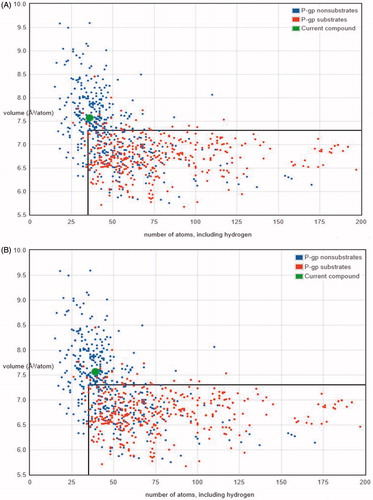
Table 3. Preclinical trial of lead compounds (compounds 7 and 9) using pkCSM and FAF-Drugs2.
Table 4. Synthetic accessibility analyses of standard compounds and lead compounds using SwissADME.