
Figures & data
Figure 1. Snapshots before and after energy minimizations step runs for (a) nanobody and (b) PASylated nanobody. As depicted, no steric hindrance was observed for CDR3 region (red colour) in both proteins. (c) Superimposition of nanobody fragment revealed just a small spatial distortion in the three-dimensional structure of nanobody.
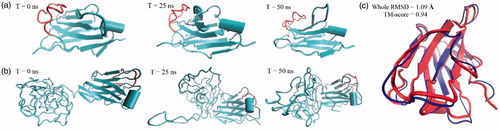
Table 1. Calculated conformational parameters for equilibrated structures.
Table 2. Calculated kinetic and affinity parameters for PASylated nanobody and native protein [ka: association rate constant; kd: dissociation rate constant and KD: equilibrium binding constant].
Figure 2. (a) Electrophoretic mobility of anti-VGEFA nanobody and the PASylated form on 15% SDS-polyacrylamide gel. Lane 1: Marker; Lane 2: Nanobody; Lane 3: Nb-PAS#1(200). SDS-PAGE investigation shows Ni-NTA-purified nanobody and PASylated nanobody have molecular weights of 15 and 75 kDa, respectively. Western blot analysis using ECL method identified specified bonds for the proteins (b and c).
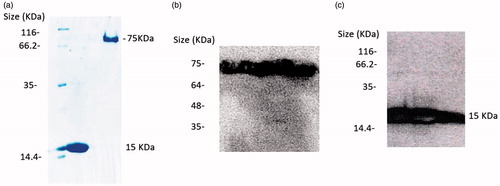
Figure 3. Hydrodynamic radius and molecular weight characterizations. (a) SEC of native protein and PASylated nanobody was performed using molecular weight markers [(1) 670 kDa (Thyroglobulin, bovine), (2) 158 kDa (γ-globulin, bovine), (3) 44 kDa (Ovalbumin, chicken), (4) 17 kDa (Myoglobin, horse) and (5) 1.35 kDa (Vitamin B12)]. As depicted, a remarkable increase has seen in molecular weight of PASylated nanobody. Size distribution analysis of (b) native and (c) PASylated nanobody revealed main peaks at 77.16 and 424 nm for native and PASylated form, respectively. (d) Mass spectrometric analysis by MALDI-TOF/TOF. A single peak with a molecular weight of 28591.3867 Da was observed for Nb-PAS#1(200).
![Figure 3. Hydrodynamic radius and molecular weight characterizations. (a) SEC of native protein and PASylated nanobody was performed using molecular weight markers [(1) 670 kDa (Thyroglobulin, bovine), (2) 158 kDa (γ-globulin, bovine), (3) 44 kDa (Ovalbumin, chicken), (4) 17 kDa (Myoglobin, horse) and (5) 1.35 kDa (Vitamin B12)]. As depicted, a remarkable increase has seen in molecular weight of PASylated nanobody. Size distribution analysis of (b) native and (c) PASylated nanobody revealed main peaks at 77.16 and 424 nm for native and PASylated form, respectively. (d) Mass spectrometric analysis by MALDI-TOF/TOF. A single peak with a molecular weight of 28591.3867 Da was observed for Nb-PAS#1(200).](/cms/asset/078dd510-442a-460b-ab26-c710a2c78314/ianb_a_1369426_f0003_c.jpg)
Figure 4. Light scattering for assessing protein aggregates. A peak shift to micron size range was observed for native protein after 3 months incubation (77.16–5919.9 nm), while no significant change was seen for PASylated form at the same conditions (424–496.5 nm).
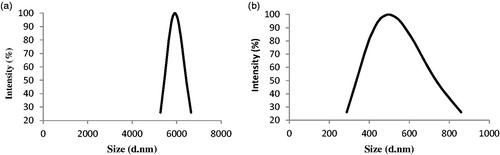
Figure 5. Secondary structure analysis by Far-UV CD spectroscopy. (a) CD spectra of nanobody (upper line) and PASylated nanobody (lower lines). (b) Molar ellipticity calculations demonstrate negative shift around 204 nm in the curve of PASylated nanobody compared to native protein.
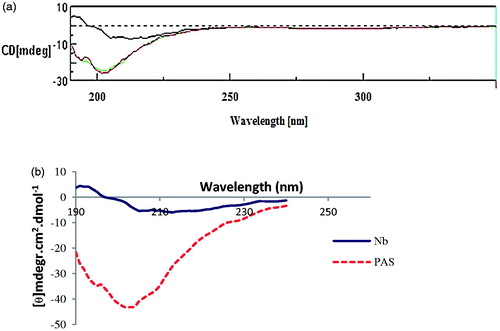
Figure 6. Isoelectric focusing of PASylated nanobody and native protein revealed both proteins have a similar net charge with a pI around 7 [Lane 1; Marker; Lane2; Nanobody, Lane 3; Nanobody-PAS#1(200)].
![Figure 6. Isoelectric focusing of PASylated nanobody and native protein revealed both proteins have a similar net charge with a pI around 7 [Lane 1; Marker; Lane2; Nanobody, Lane 3; Nanobody-PAS#1(200)].](/cms/asset/ef99b086-cd08-4ae7-906e-3bc512d6ef8a/ianb_a_1369426_f0006_b.jpg)
Figure 7. Binding assessment of nanobody and nanobody-PAS#1(200) by ELISA. Bevacizumab was used as positive control and data are represented as mean ± SD. The results showed that the PASylated nanobody is reached to saturation state at lower concentrations than the native protein.
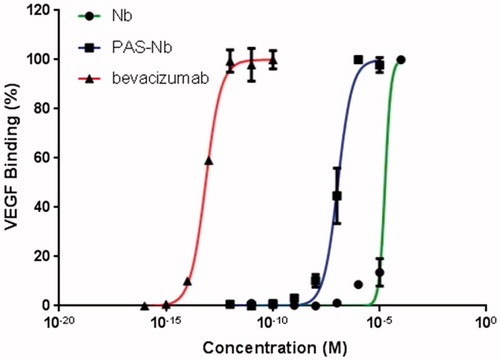
Figure 8. Biacore sensorgrams obtained by binding kinetics assay. (a) Nanobody with rhVEGFA165. (b) PASylated nanobody with rhVEGFA165. Curves from top to bottom corresponded to the solutions of 0.312, 0.625, 1.25, 2.5, 5, and 10 μg/ml of VEGFA165.
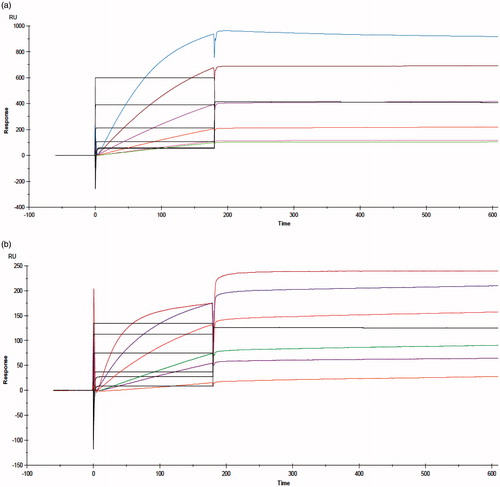
Figure 9. Antiproliferative activity of PASylated nanobody, nanobody and bevacizumab on (a) HUVECs and (b) HEK293. Data are represented as mean ± SD and asterisks show the statistical level of significance between cell proliferation of the samples and VEGFA group (***p<.001).
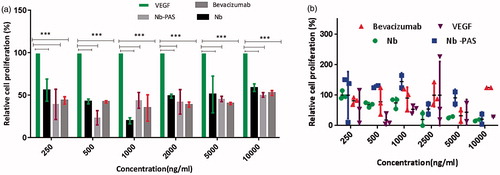
Figure 10. (a) Anti-migration activity of PASylated nanobody in comparison to the native protein on HUVECs. Data are represented as mean ± SD and bevacizumab was used as a control. (b) Representative snapshots, captured from migration assay on HUVECs (1) Control (tfinal), (2) scratched cells (tinitial) (3) nanobody (2000 ng/ml) and (4) Nb-PAS#1(200) (2000 ng/ml). As depicted in the figure, both Nb-PAS#1(200) and nanobody strongly inhibit the migration of HUVECs at a concentration of 2000 ng/ml.
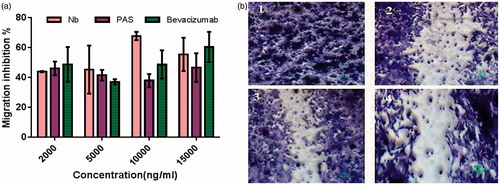
Figure 11. (a) Anti-angiogenesis effects of PASylated nanobody assessed by in vitro tube formation method. Data are represented as mean ± SD and asterisks show the significant level of capillary branch-inhibitory difference between native protein and PASylated nanobody (***p < .001). (b) Representative snapshots captured from the tube formation assay on HUVECs (1) Control (no drug), (2) nanobody (2000 ng/ml), (3) nanobody (10,000 ng/ml) and (4) Nb-PAS#1(200) (10,000 ng/ml).
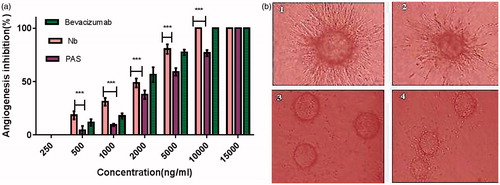
Figure 12. Pharmacokinetic profiles of PASylated nanobody and native protein at an intravenous dose of 5 mg/kg in BALB/c mice. As depicted in the figure, native protein and the PASylated nanobody are not detectable in the plasma after 6 and 54 h, respectively.
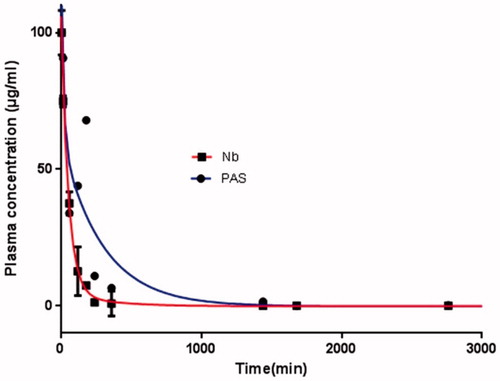
Table 3. Calculated pharmacokinetic parameters using a log-linear trapezoidal method for PASylated nanobody and native protein.