Figures & data
Figure 1. UV–vis spectra of the reaction mixture for CP-AuNps (a) and CP-AgClNps (b), respectively.
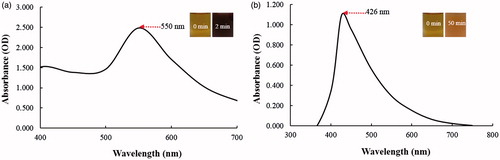
Figure 2. Physicochemical characterization of CP-AuNps (a) and CP-AgClNps (b). Notes: Field emission transmission electron micrographs showed that CP-AuNps and CP-AgClNps are hexagon and square-spherical shape (a-i, a-iii, b-i, and b-iii) and the selected area electron diffraction pattern revealed the crystalline nature of the biosynthesized nanoparticles (a-ii and b-ii). Elemental mapping (a-iv, b-iv and b-v) and energy dispersive X-ray spectroscopy (a-v and b-vi) confirmed the purity of the nanoparticles.
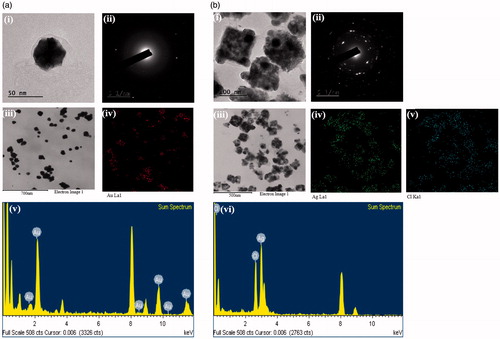
Figure 3. Particle size distribution profile of CP-AuNps (a) and CP-AgClNps (b) with respect to intensity (i), number (ii), and volume (iii).
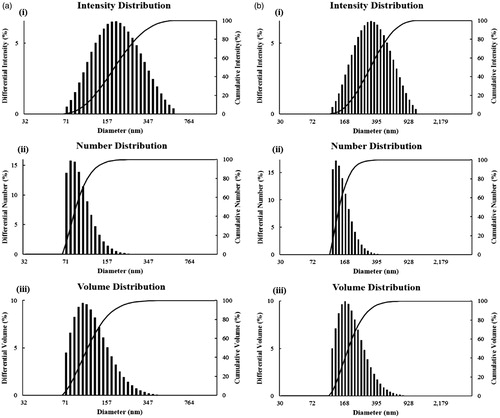
Figure 4. X-ray diffraction spectrum of CP-AuNps (a) and CP-AgClNps (b).
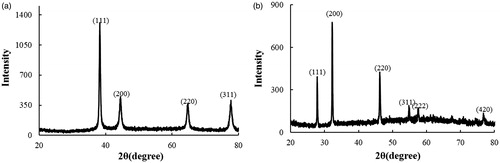
Figure 5. FT-IR spectra of fruit extract, CP-AuNps and CP-AgClNps.
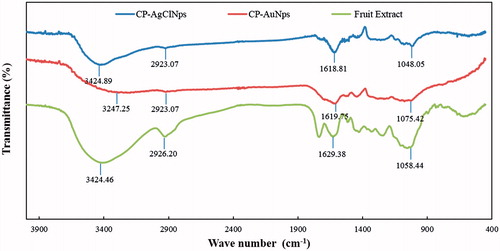
Figure 6. Antimicrobial activity of nanoparticles in comparison with antibiotics against Escherichia coli [ATCC 10798] (a), Staphylococcus aureus [ATCC 6538] (b). Zone of inhibition of CP-AgClNps and Neomycin (N30) as standard antibiotics as control against E. coli and S. aureus (c). Values of MIC and MBC for CP-AgClNps against E. coli and S. aureus (d). Error bars represent the standard deviation (n = 3).
![Figure 6. Antimicrobial activity of nanoparticles in comparison with antibiotics against Escherichia coli [ATCC 10798] (a), Staphylococcus aureus [ATCC 6538] (b). Zone of inhibition of CP-AgClNps and Neomycin (N30) as standard antibiotics as control against E. coli and S. aureus (c). Values of MIC and MBC for CP-AgClNps against E. coli and S. aureus (d). Error bars represent the standard deviation (n = 3).](/cms/asset/feffaac3-3dda-4522-9560-f0f808cfe3a2/ianb_a_1376674_f0006_c.jpg)
Figure 7. The DPPH inhibition assay elucidates the antioxidant potential of fruit extract, CP-AuNps and CP-AgClNps. Error bars represent the standard deviation (n = 3).
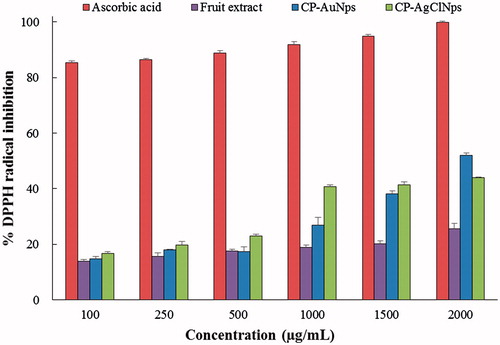
Figure 8. MTT assay was used to examine the effect of various concentrations of CP-AuNps (a) and CP-AgClNps (b) on the RAW264.7cells. Notes: The cells were incubated with the nanoparticles for 24 h, and the experiment was repeated three times independently. Error bars represent the standard deviation (n ≥ 3). ***p < .001 versus control (untreated group).
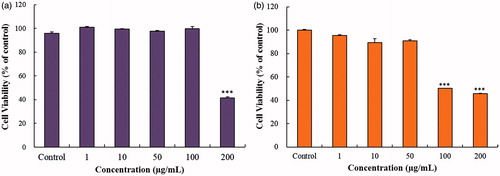
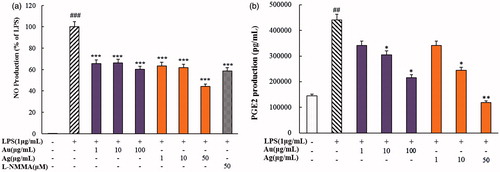
Figure 9. Effects of CP-AuNps and CP-AgClNps on LPS-induced expression of nitric oxide (NO) (a) and PGE2 production (b) in RAW 264.7 cells. Notes: The experiment was repeated at least three times. Error bars represent the standard deviation (n ≥ 3). ##.001< p ≤ .01 and ###p ≤ .001 versus control cells; *.01< p ≤ .05, **.001< p ≤ .01 and ***p ≤ .001 versus LPS-treated cells.