Figures & data
Figure 1. Flow diagram of Schizonepetae Herba Carbonisata-carbon dots (SHC-CDs) preparation process.
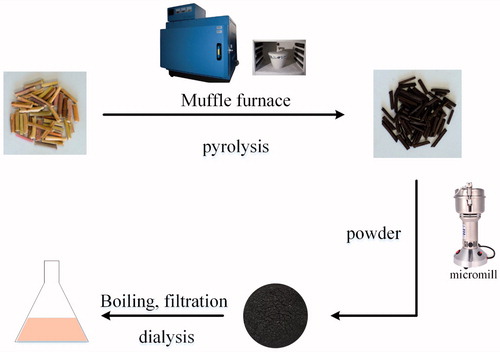
Figure 2. (A) Transmission electron microscopy (TEM) images of Schizonepetae Herba Carbonisata-carbon dots (SHC-CDs) displaying ultra-small particles. Inset: histogram depicting particle size distribution. (B) High-resolution TEM (HRTEM) image of SHC-CDs. Inset: HRTEM image of atomic lattice fringes. (C) XRD pattern, (D) ultraviolet--visible (UV--vis), (E) fluorescence and (F) FTIR spectra.
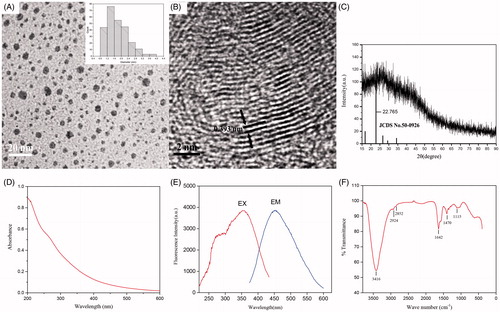
Figure 3. (A) X-ray photoelectron spectroscopy (XPS) survey spectra. (B) C 1s, (C) O 1s and (D) N1s XPS spectra.
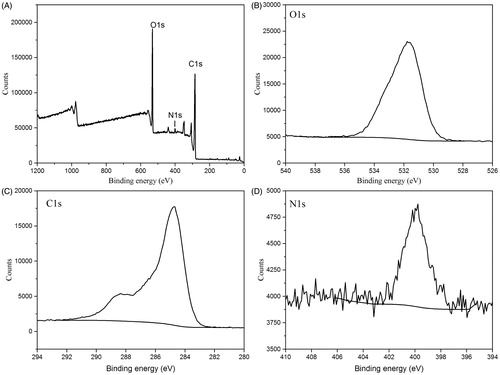
Figure 4. Cell viability of RAW 264.7 after incubation with various concentrations of Schizonepetae Herba Carbonisata-carbon dots (SHC-CDs) for 24 h.
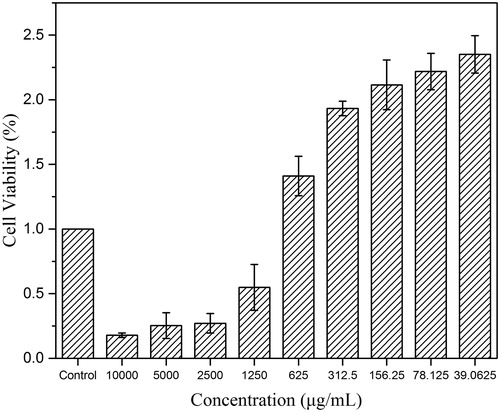
Figure 5. High-performance liquid chromatography (HPLC) profile of (A) Schizonepetae Herba (SH) and (B) SH carbonisata-carbon dots (SHC-CDs).
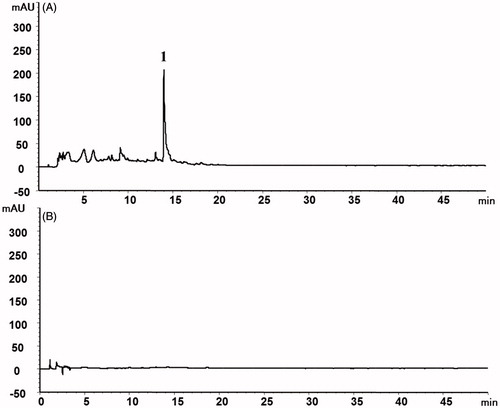
Figure 6. Study of time to haemostasis in Kunming mouse: (A) Tail amputation (n = 6) and (B) liver scratch (n = 8) models treated with normal saline (NS), haemocoagulase (HC) and different concentrations of Schizonepetae Herba Carbonisata-carbon dots (SHC-CDs). **p < .01 and *p < .05 compared with control group.

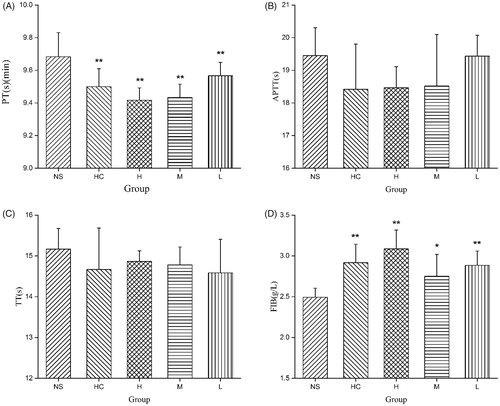
Figure 7. (A) Prothrombin time (PT), (B) activated partial thromboplastin time (APTT), (C) thrombin (TT) and (D) fibrinogen (FIB) analysis of mice treated with normal saline (NS), haemocoagulase (HC), and different concentration of Schizonepetae Herba Carbonisata-carbon dots (SHC-CDs). **p < .01 and *p < .05 compared with control group (n = 6).