Figures & data
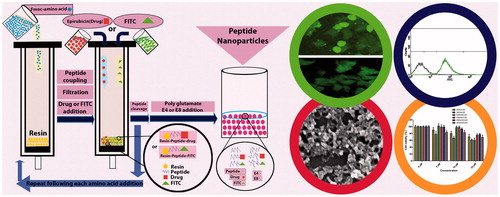
Figure 1. The schematic peptide synthesis of K3W4K3 (a), the schematic synthesis of FITC-labeled K3W4K3 (b) and the schematic synthesis of K3W4K3-EPR conjugate (c).
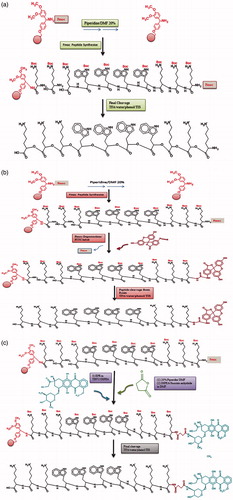
Table 1. Different cell penetrating peptide amphiphiles (CPPs) synthesized in the present study.
Table 2. The percentage of drug (EPR) loading for different peptide-EPR conjugates (CPPs-EPR).
Figure 2. MTT-based cytotoxicity of different CPPs (a), CPPs-E4 nanoparticles (b) and CPPs-E8 nanoparticles (c) at various concentrations (5, 10 and 25 µM) after 48 h incubation in MCF-7 cell line at 37 °C. Data represent Mean ± SD for six replicates.
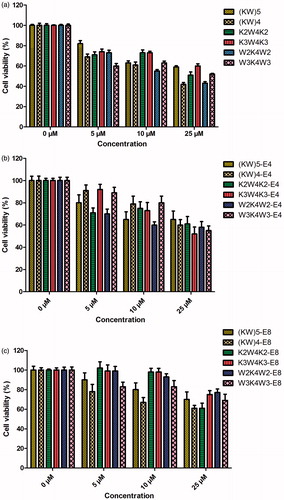
Figure 3. Fluorescence microscopy images of MCF-7 cells incubated with FITC-labeled CPPs and their corresponding nanoparticles (CPPs-E8) at concentration of 10 (a) and 50 µM (b), respectively after 2 h incubation at 37 °C.
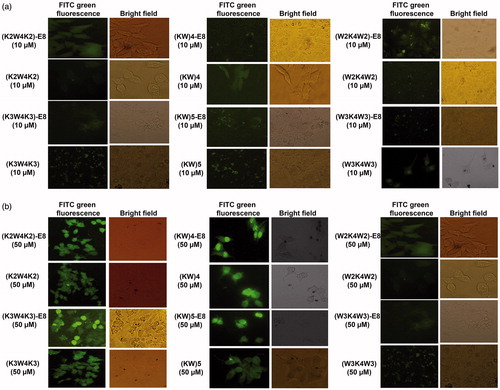
Figure 4. Cellular uptake (%) of FITC-CPPs and the corresponding nanoparticles (FITC-CPPs-E8) at different concentration of 10, 25 and 50 µM, respectively after 2 h incubation in MCF-7 cell at 37 °C. Data represent Mean ± SD for three replicates. FITC-CPPs and FITC-CPPs and FITC-CPPs-E8 nanoparticles are presented by solid lines with the symbol of ▪ and dashed lines with the symbol of •, respectively.
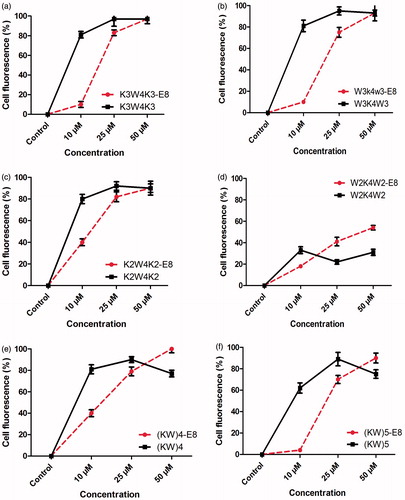
Figure 5. Flow cytometry histograms of MCF-7 cells treated for 2 h with K3W4K3 (left) and K3W4K3-E8 (right) at various concentrations of 10 (a and d), 25 (b and e) and 50 (c and f) µM, respectively. First peak corresponds to untreated control cells.
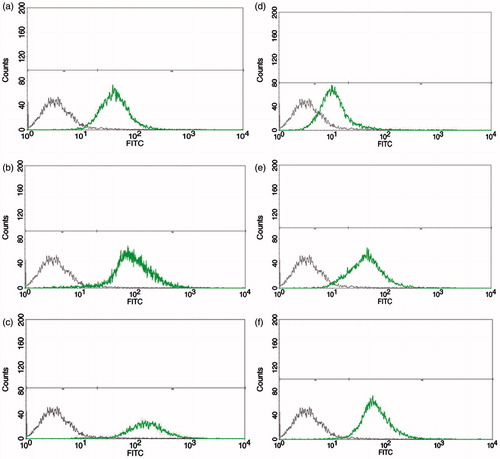
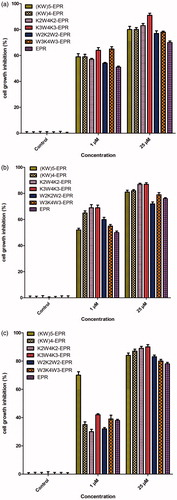
Figure 6. MTT-based anti-proliferative activity of different CPPs-EPR (a), CPPs-E4-EPR (b) and CPPs-E8-EPR (c) in comparison with free drug (EPR) at various concentrations (1, 5, 10 and 25 µM) after 48 h incubation in MCF-7 cells at 37° C. Data represent Mean ± SD for six replicates.