
Figures & data
Scheme 1. Schematic illustration of the synthesis, characterization and photothermal effects of poly(ethylene glycol) coated gold@iron oxide core–shell nanoparticles conjugated with folic acid (FA–PEG–Au@IONP).
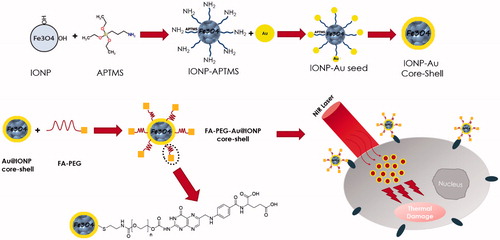
Figure 1. Schematic illustration of synthesis route of folate conjugated nanocomplex.
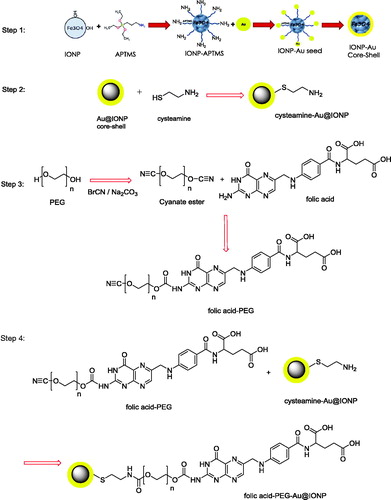
Figure 2. (a) TEM image (inset is the high-resolution TEM image), (b) size distribution histogram of TEM image, (c) dynamic light scattering (DLS) profile of the prepared nanocomplex (PdI: 0.24). (d) zeta potentials of various nanoparticles synthesized in this study.
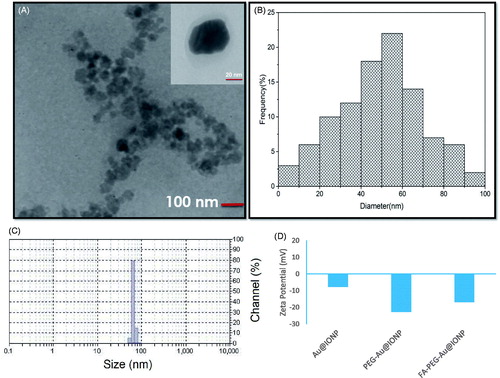
Figure 3. Absorption spectra of (a) Fe3O4 nanoparticles, (b) AuNPs, and (c) core–shell nanocomplex.
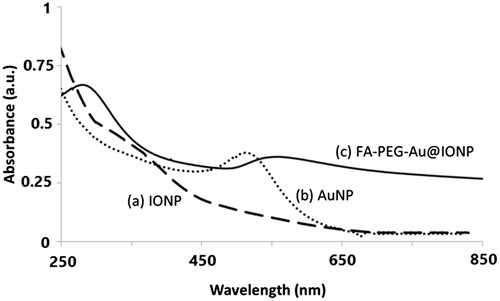
Figure 4. Magnetization curve of Au@IONPs and FA–PEG–Au@IONPs nanocomplex at 300 K.
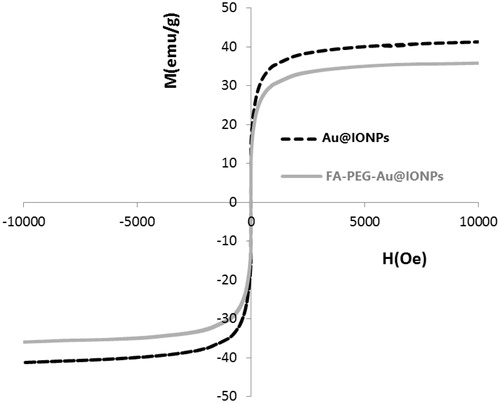
Figure 5. FTIR spectra of Au@IONPs, PEG–Au@IONPs, folic acid, and FA–PEG–Au@IONPs.
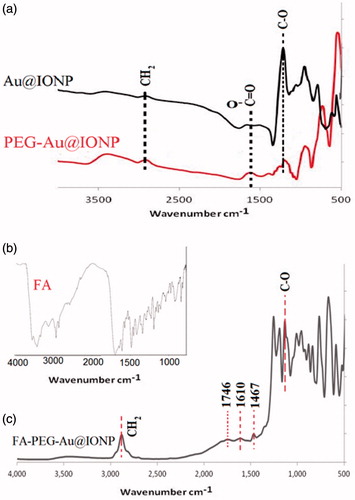
Figure 6. Cell viability of both KB and MCF-7 cell lines receiving various treatments.
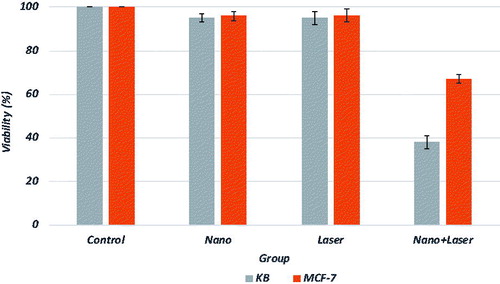
Figure 7. Flow cytometric analysis to determine death modes of KB and MCF-7 cells after receiving various treatments. Cells were double-stained with Annexin V-FITC and PI to detect early apoptosis and necrosis, respectively.
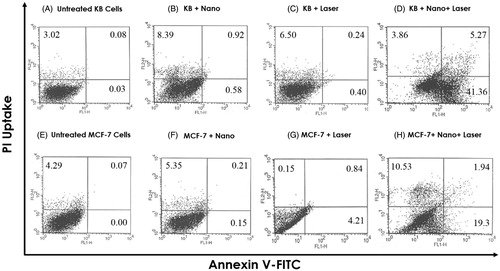
Table 1. Comparison between the results of this study and other publications related to nano-photo-thermal therapy of cancer cells.